

Release Date :
Reference Number :
SR-2025-03-003
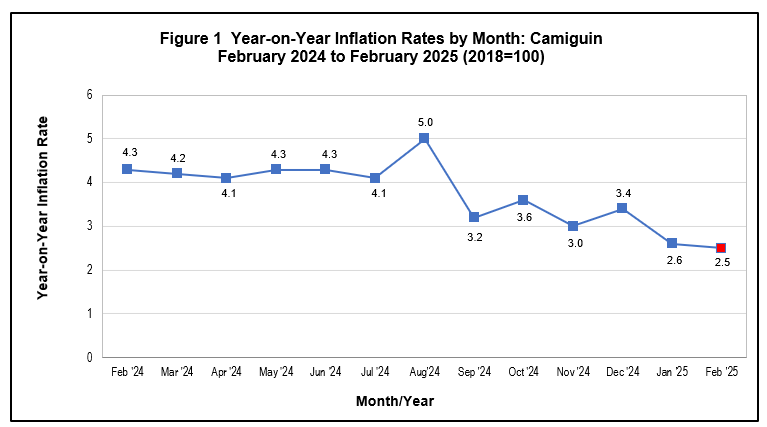
The inflation rate in Camiguin slowed down to 2.5 percent in February 2025
The inflation in Camiguin has a slower rate of increase of 2.5 percent in February 2025 from the 2.6 percent posted in January 2025. In February 2024, inflation rate was higher at 4.3 percent. The province's year-to-date inflation rate is at 2.6 percent. (See Figure 1)
Source: Survey of Retail Prices of Commodities for the Generation of CPI, PSA
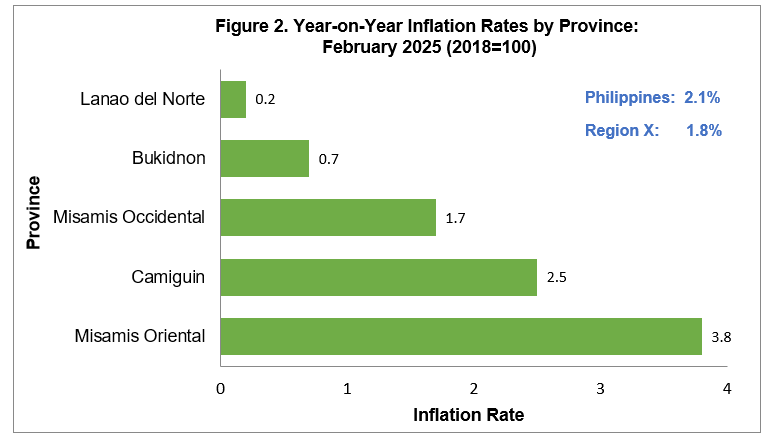
In Northern Mindanao, all provinces registered a decrease in its inflation rates in February 2025. The province of Misamis Oriental recorded a slowing down at 3.8 percent, down by 1.5 percentage points from the 5.3 percent in January 2025.
Similarly, inflation rates in Misamis Occidental, Bukidnon, Camiguin, and Lanao del Norte decelerated to 0.7 percent, 1.7 percent, 2.5 percent, and 0.2 percent respectively. (See Figure 2)
Figure 2 presents the annual inflation rates of the provinces in Region X in February 2025.
Source: Survey of Retail Prices of Commodities for the Generation of CPI, PSA
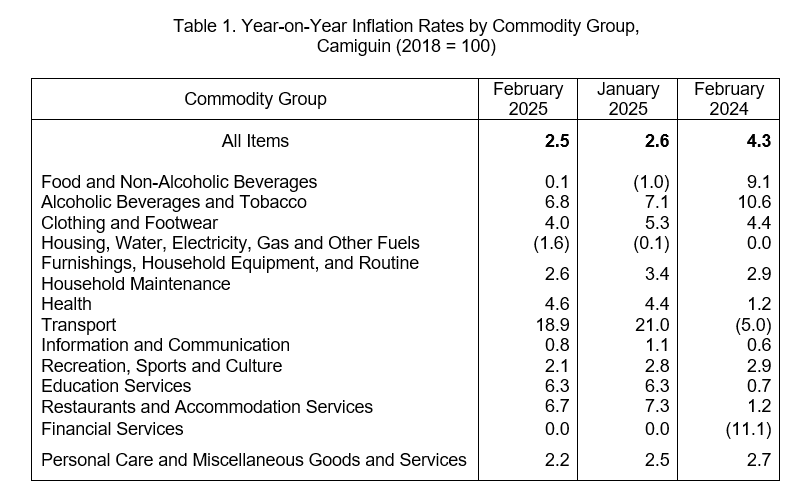
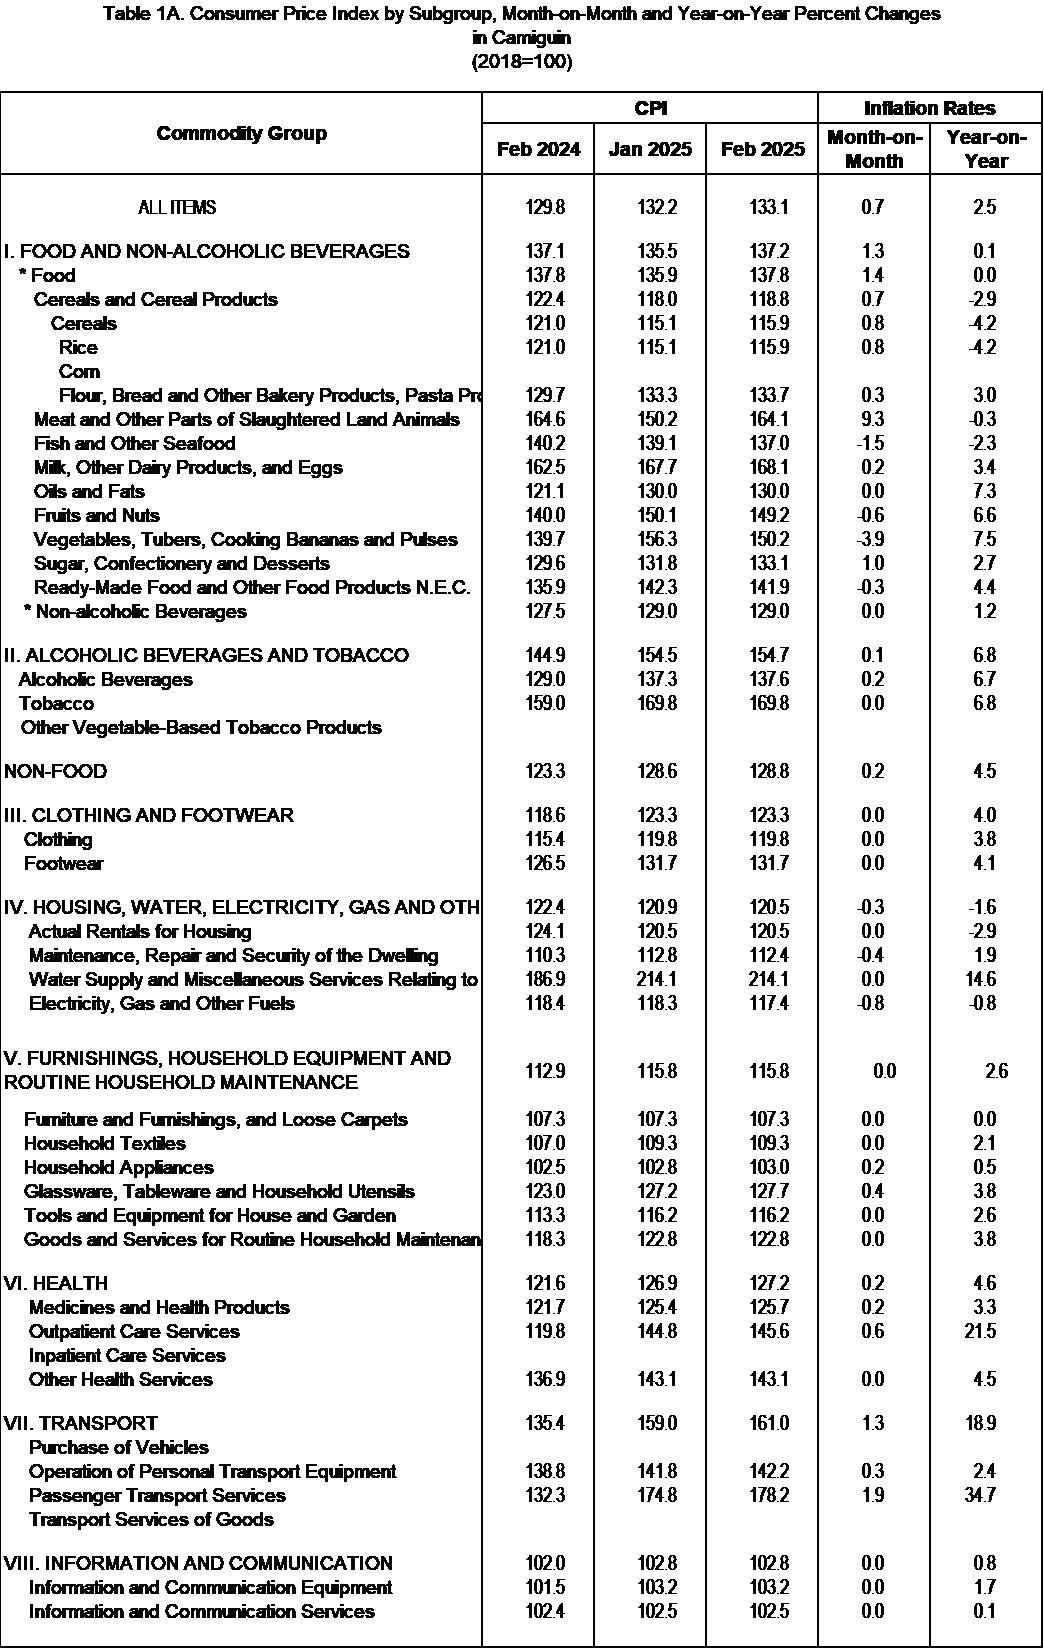
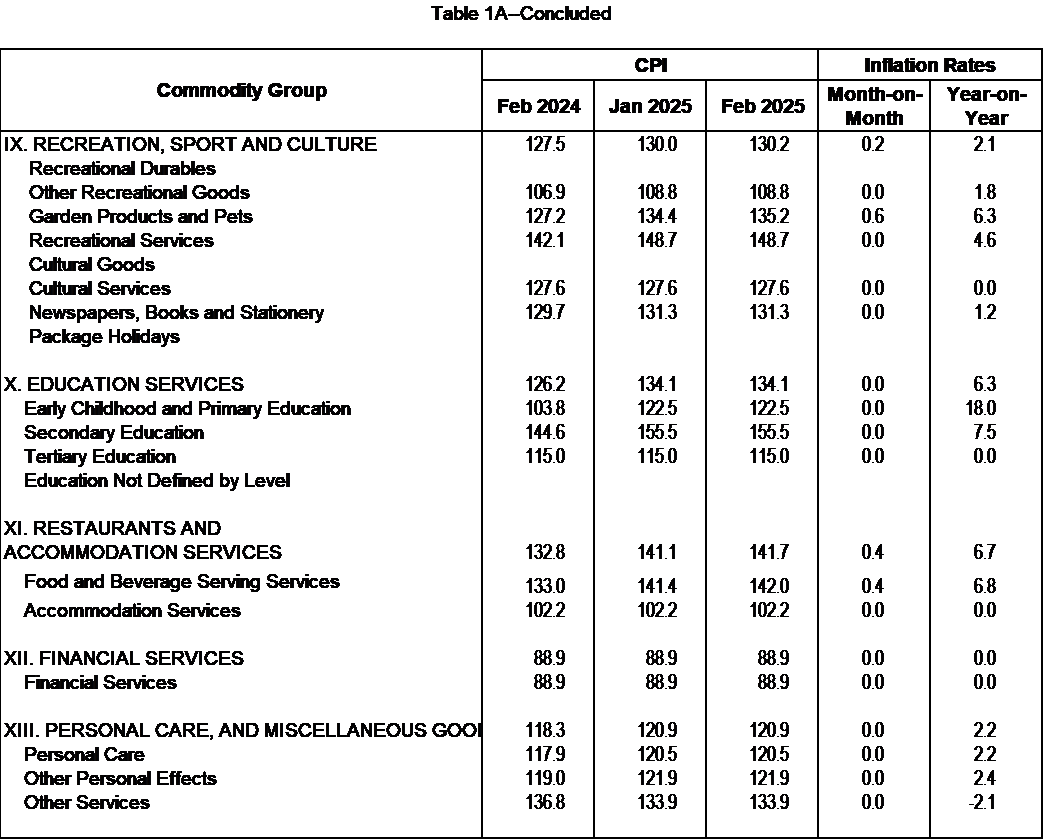
The annual inflation rate’s decrease in the province for February 2025 was caused by a decline in the index of housing, water, electricity, gas and other fuels at 1.6 percent and slower rates in the lower annual increases of the following indices:
Alcoholic beverages and tobacco, 6.8 percent;
Clothing and footwear, 4.0 percent;
Furnishings, household equipment and routine household maintenance, 2.6 percent;
Transport, 9 percent;
Information and communication, 0.8 percent;
Recreation, sport, and culture, 2.1 percent;
Restaurants and accommodation services, 6.7 percent; and
Personal care, and miscellaneous goods and services, 2.2 percent.
On the contrary, the commodity groups of food and non-alcoholic beverages and health posted faster rate of increases with 0.1 percent and 4.6 percent respectively.
Furthermore, education and financial services maintained the same inflation rate as in January 2025. (See Table 1)
Table 1. Year-on-Year Inflation Rates by Commodity Group,
Camiguin (2018 = 100)
Source, Survey of Retail Prices of Commodities for the Generation of CPI PSA
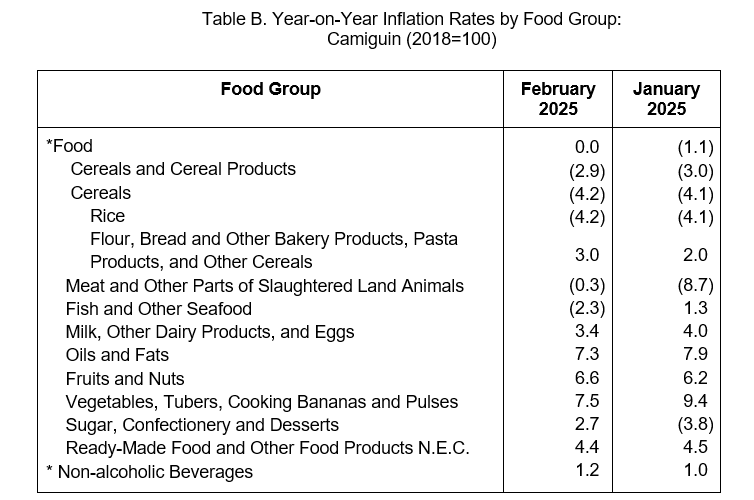
The slowing down of food in February 2025 was primarily brought about by the decline of heavily weighted rice at 4.2 percent. Declines were also registered in cereals and cereals products (2.9%), meat and other parts of slaughtered land animals (0.3%), and fish and other seafood (2.3%). Moreover, slower rate of increases was noted in the following food items:
Milk, other dairy products, and eggs, 3.4 percent;
Oils and fats, 7.3 percent;
Vegetables, tubers, cooking bananas and pulses, 7.5 percent; and
Ready-made food and other food products n.e.c., 4.4 percent.
On the other hand, faster rate of increases was registered in the food groups of flour, bread and other bakery products, pasta products, and other cereals with 3.0 percent, fruits and nuts with 6.6 percent, and sugar, confectionery, and desserts with 2.7 percent. (See Table B and Table 1A)
Table B. Year-on-Year Inflation Rates by Food Group:
Camiguin (2018=100)
Top of Form
(SGD.)FRANCISCO C. GALAGAR, JR.
Chief Statistical Specialist
Technical Notes
This Special Release presents the results of the Survey of Retail Prices of Commodities and Services for the Generation of Consumer Price Index (CPI) conducted in February 2025.
CPI
The CPI is an indicator of the change in the average retail prices of a fixed basket of goods and services commonly purchased by households for their day-to-day consumption relative to a base year.
Uses of the CPI
As an indicator, the CPI is most widely used in the calculation of the inflation rate and purchasing power of the peso. It is a major statistical series used for economic analysis and as a government economic policy monitoring indicator.
The CPI is also used as a deflator to express value series in real terms, which is, measuring the change in actual volume of transactions by removing the effects of price changes. Another major importance of the CPI is its use as a basis to adjust wages in labor-management contracts and pensions and retirement benefits. The CPI also inputs wage adjustments through collective bargaining agreements.
Components of the CPI
Base Period
This is a reference date or simply a convenient benchmark to which a continuous series of index numbers can be related. Since the CPI measures the average changes in the retail prices of a fixed basket of goods, it is necessary to compare the movement in previous years back to a reference date at which the index is taken as equal to 100.
The present series uses 2018 as the base year. The year 2018 was chosen as the base year because it is the year when the Family Income and Expenditure Survey (FIES) was conducted. The FIES is the basis of the CPI weights.
a. Market Basket
Market basket refers to a sample of thousands of varieties of goods purchased for consumption and services availed by households in the country. It was selected to represent the composite price behavior of all goods and services purchased by the consumers.
b. Weighting System
The weighting system is a desirable system that considers the relevance of the components of the index. For the CPI, the weighting pattern uses the expenditures on various consumer items purchased by households as a proportion to total expenditures.
c. Geographic Coverage
CPI values are computed at the national, regional, and provincial levels, and for selected cities. A separate CPI for NCR is also computed.
d. Classification Standards
The 2012-based CPI series is the first in the series that used the 1999 United Nations Classification of the Individual Consumption According to Purpose (COICOP) in determining the commodity groupings of the items and services included in the market basket. The 2018-based CPI also follows the 2015 Philippine Standard Geographic Classification codes.
Inflation Rate
The inflation rate (IR) is the annual or monthly rate of change of the CPI in percent. It is interpreted in terms of the declining purchasing power of money.
Source: Retail Price Survey of Commodities for the Generation of Consumer Price Index, Philippine Statistics Authority
| Attachment | Size |
|---|---|
|
|
391.7 KB |