

Day 1 of 3: Region 10 delegates at the 4th National Convention on Civil Registration and Vital Statistics, held from 28 to 30 July 2025 at the SMX Convention Center Clark, Mabalacat City, Pampanga.
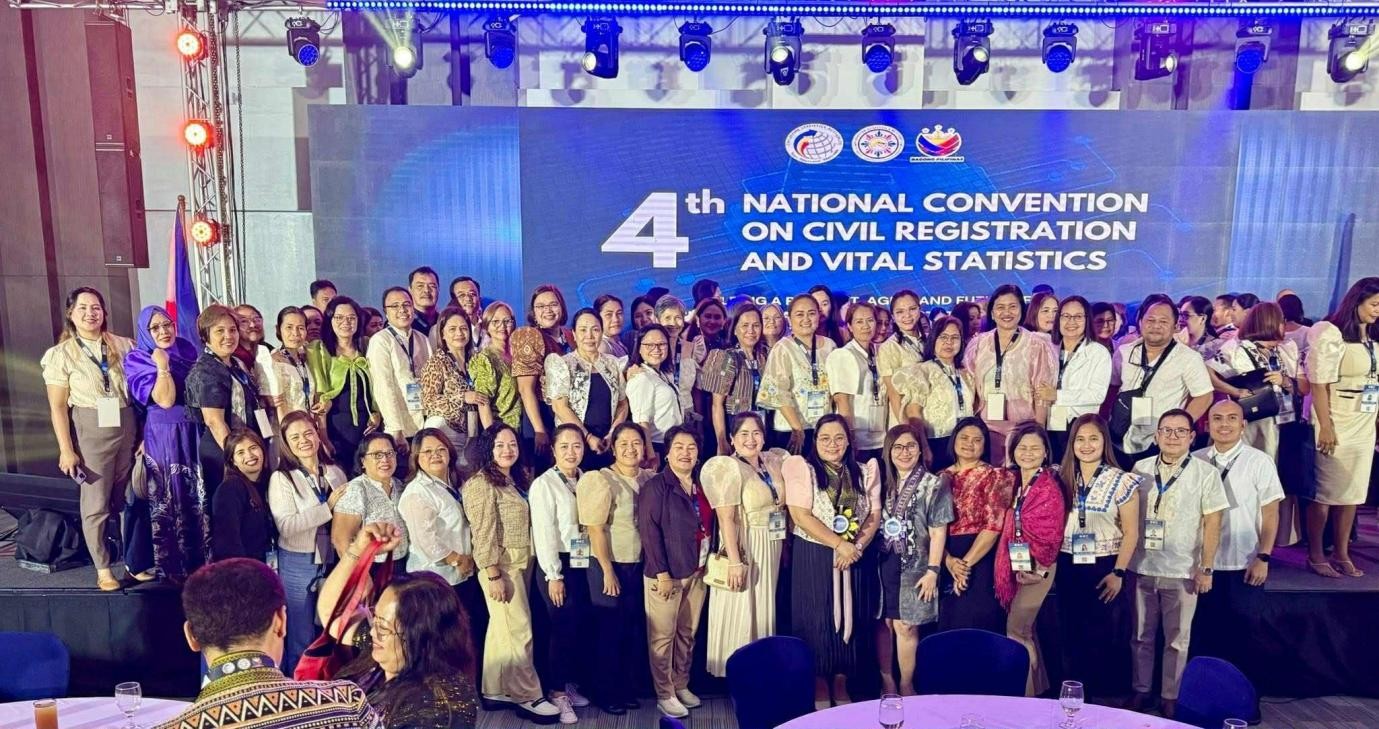
The Philippine Statistics Authority – Regional Statistical Services Office X (PSA RSSO X) proudly recognizes and honors the outstanding Local Civil Registry Offices (LCROs) in Region X for their exceptional achievements during the 4th National Convention on Civil Registration and Vital Statistics (NCCRVS), held from July 28 to 30, 2025 at the SMX Convention Center Clark, Mabalacat City, Pampanga.
The national convention gathered local civil registrars, solemnizing officers, members of the academe, statisticians, and various stakeholders from across the country to foster collaboration, showcase innovations, and recognize outstanding Local Civil Registry Offices (LCROs).
The 4th NCCRVS is led by the Philippine Statistics Authority (PSA) in line with Presidential Proclamation No. 1106, series of 2015, issued on 20 August 2015, which declared the years 2015 to 2024 as the Civil Registration and Vital Statistics (CRVS) Decade in the Philippines. The CRVS Decade was further extended to 2030 following the adoption of the Ministerial Declaration on a Decade of Action for Inclusive and Resilient Civil Registration and Vital Statistics (CRVS) in Asia and the Pacific.
PSA RSSO X proudly celebrates the following LCRO awardees:
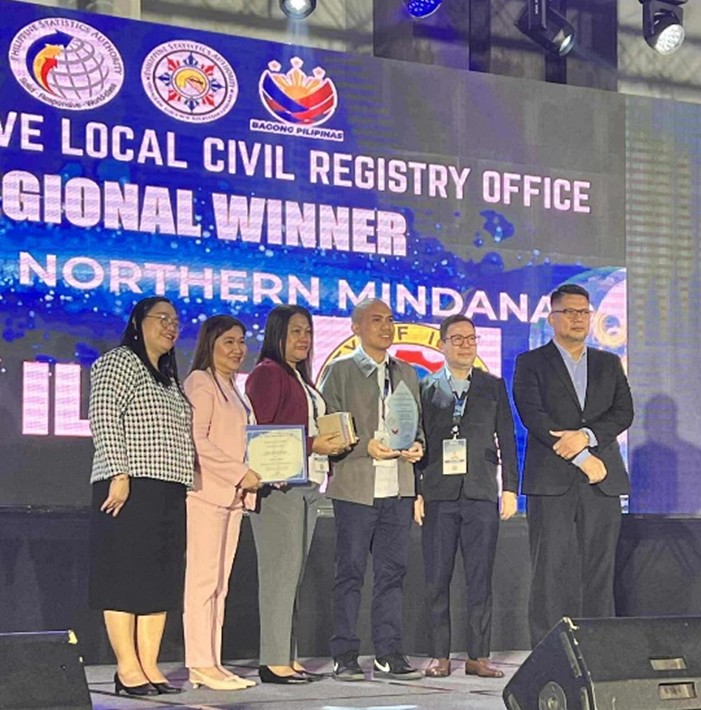
- Regional Winner – Most Innovative Local Civil Registry Office 🏆 Iligan City
This prestigious award recognizes Iligan City for its outstanding initiatives and creative approaches in enhancing civil registration services and operations.
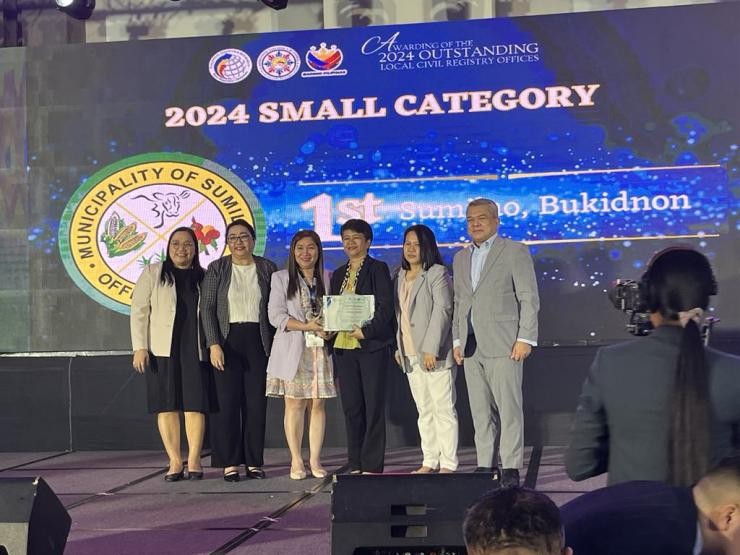
Most Outstanding Local Civil Registry Office Awards:
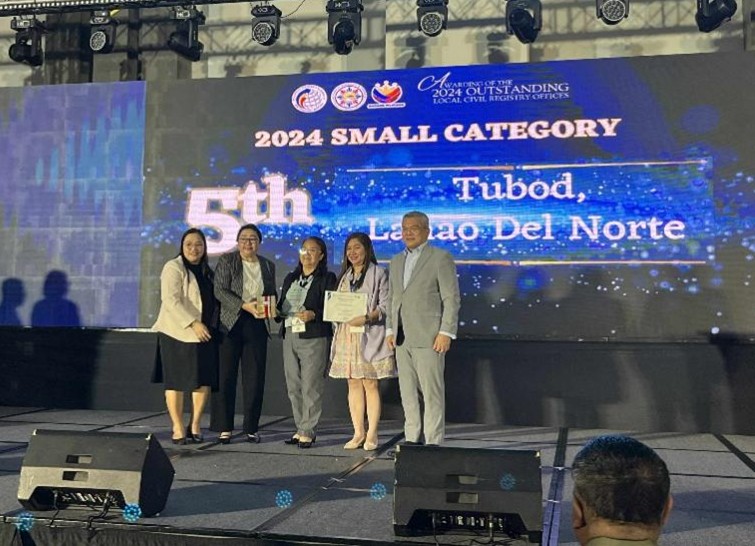
A. SMALL CATEGORY
🥇 Top 1 – Sumilao, Bukidnon
🏅 Top 5 – Tubod, Lanao del Norte

🏅 Top 8 – El Salvador City
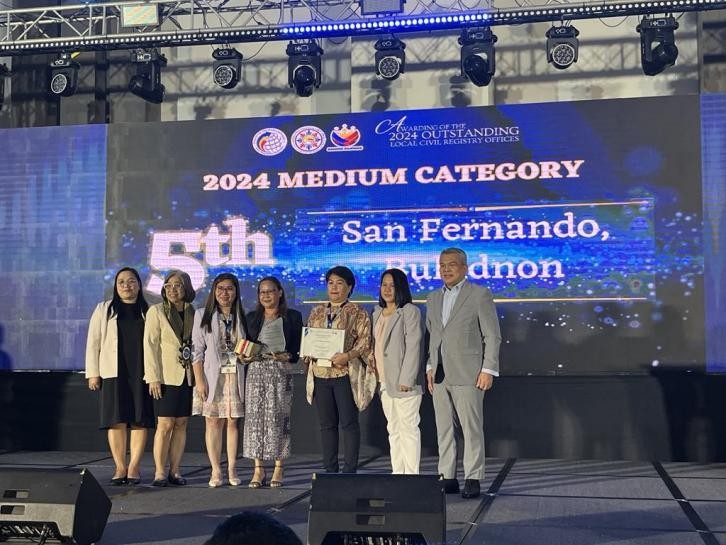
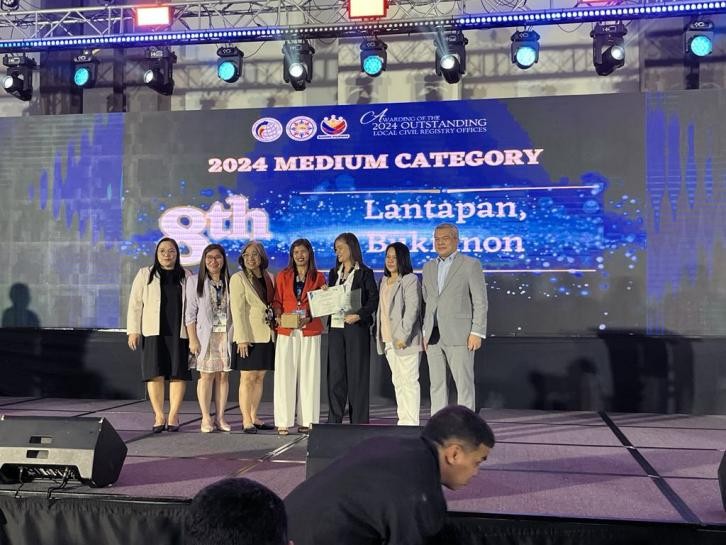
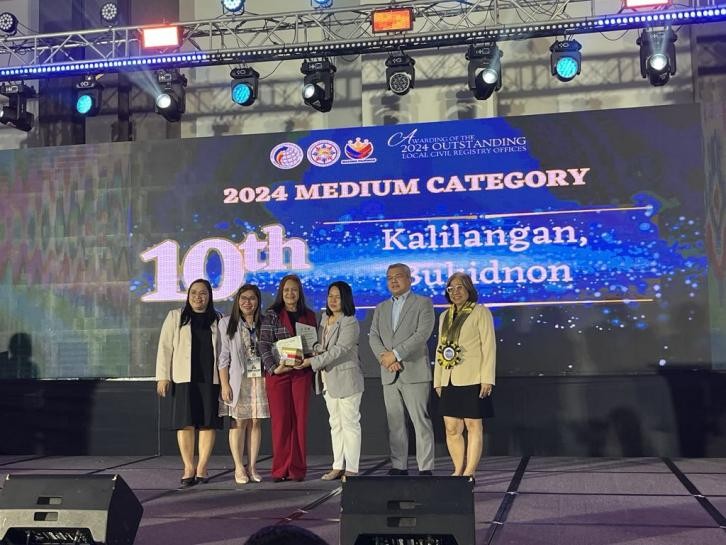
B. MEDIUM CATEGORY
🏅 Top 5 – San Fernando, Bukidnon
🏅 Top 8 – Lantapan, Bukidnon
🏅 Top 10 – Kalilangan, Bukidnon
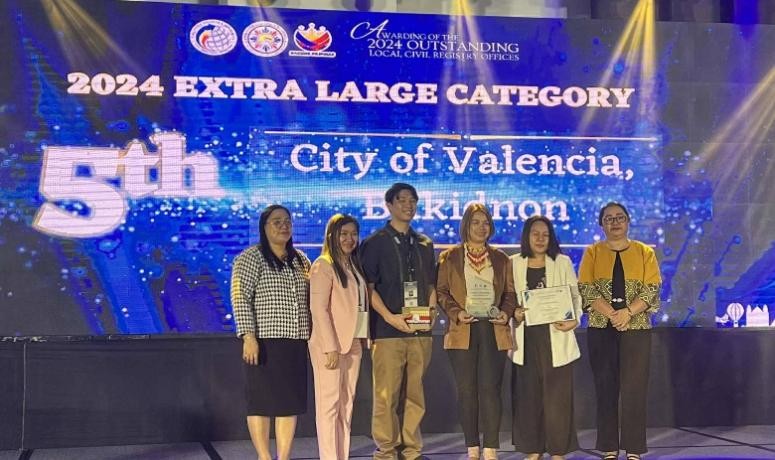
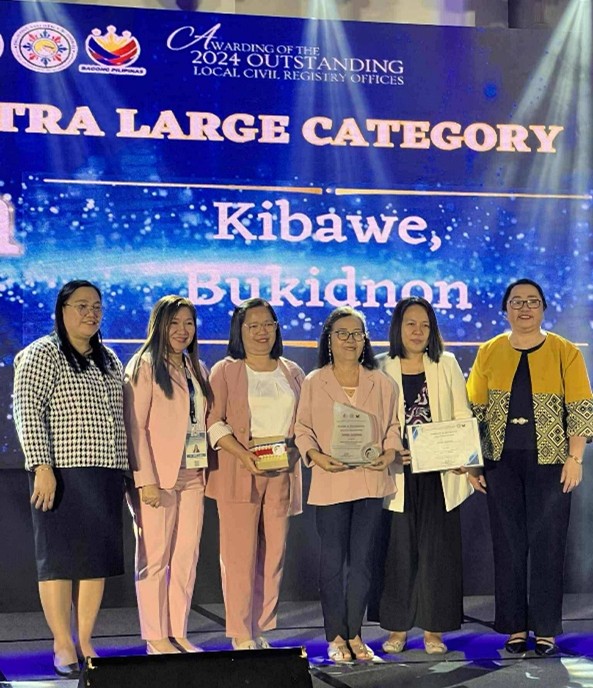
C. EXTRA LARGE CATEGORY
🏅 Top 5 – Valencia City, Bukidnon
🏅 Top 10 – Kibawe, Bukidnon
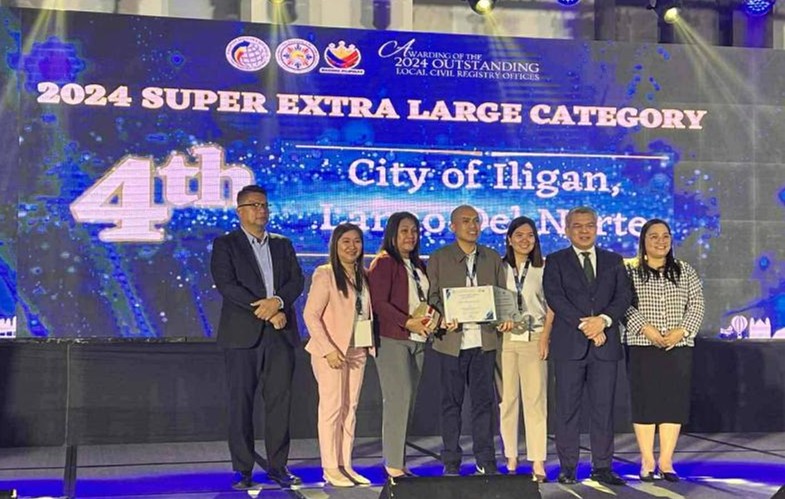
D. SUPER EXTRA-LARGE CATEGORY
🏅 Top 4 – Iligan City
These well-deserved awards affirm the unwavering dedication, innovation, and commitment of Region X's LCROs in delivering timely, reliable, and citizen-centered civil registration services to their respective communities.
PSA RSSO X extends its heartfelt congratulations and deep appreciation to all awardees. We are truly honored to work alongside such passionate and service-driven local civil registrars whose exemplary performance continues to elevate civil registration in Northern Mindanao.
(SGD.)JANITH C. AVES, CE, DM
Regional Director
PSA RSSO 10