Welcome to RSSO X Website!

Regional Statistical Services Office 10, NORTHERN MINDANAO (REGION X)

Address:
3F Limketkai Module 2 BPO & Cyberpark Bldg., Rosario Crescent,
Bgy. 31, Cagayan de Oro City

Landline: (088) 291-1672
Mobile: 0917-821-9152
E-mail: rsso10@psa.gov.ph
Facebook: /psarssox
Twitter: @psarssox

Northern Mindanao QuickStat

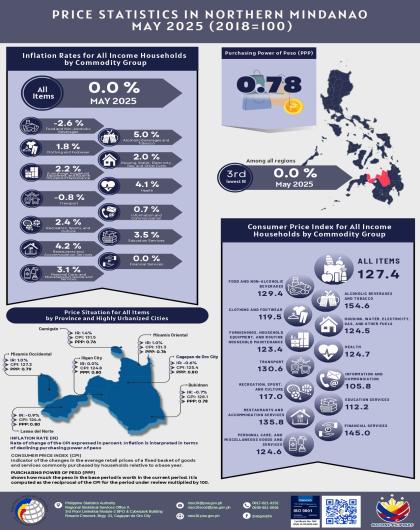
PRICE INDICES August 2023
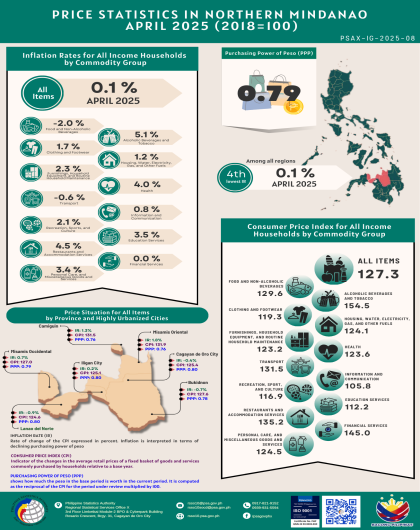
Consumer Price Index (2018 = 100) 123.0
    Inflation rate 5.0
    Purchasing power of the peso 0.81
FOREIGN TRADE June 2023
Export (FOB value in USD) 100,425,020
Import (FOB value in USD) 404,559,079
DOMESTIC TRADE
(Quantity in thousand tons;
value in P1,000)
2nd Qtr 2023 p
Water  
    Quantity 398,090
    Value 7,252,826
Air  
    Quantity 32
    Value 159
LABOR AND EMPLOYMENT
(Source: LFS)
July 2023 p
Labor force (in thousands) 3,594
    Labor force participation rate 60.5
      Employment rate 94.6
      Unemployment rate 5.4
      Underemployment rate 16.8
CONSTRUCTION 1st Qtr 2023 p
(Floor area in square meters; value in Php1,000)  
Total (number) 1,749
     Total floor area 290,293
     Value 2,123,952
Residential (number) 1,394
     Total floor area 112,936
      Value 776,126
Nonresidential (number) 261
     Total floor area 176,341
      Value 1,298,312
Additions (number) 8
     Total floor area 1,016
      Value 13,317
Alterations/repairs (number) 86
      Value 36,197
OVERSEAS EMPLOYMENT
(Source: SOF) 
2021
    Total overseas filipino workers (in thousands) 65.2
    In percent 3.6
Economy 2022
Gross Regional Domestic Product  
    (Value in thousand pesos at constant 2018 prices)  
         GRDP 935,299,921
             Agriculture, forestry and fishing 186,570,843
             Industry 238,844,186
             Services 509,884,891
   (Growth rate at constant 2018 prices) 2021-2022
        GRDP 7.2
              Agriculture, forestry and fishing 0.5
              Industry 6.6
              Services 10.1
Economy (continued) 2022
Gross Regional Domestic Expenditure
 
    (Value in thousand pesos at constant 2018 prices)
 
             Household Final Consumption Expenditure
522,174,585
             Government Final Consumption Expenditure
118,100,980
             Gross Capital Formation
164,270,528
             Exports of goods and services to Rest of the World
31,889,591
             Less : Imports of goods and services from Rest of the World 46,175,254
             Net Exports 145,039,491
             Gross Regional Domestic Expenditure 935,299,921
    (Growth rate at constant 2018 prices)
2021-2022
              Household Final Consumption Expenditure 8.4
             Government Final Consumption Expenditure 3.9
             Gross Capital Formation 10.0
             Exports of goods and services to Rest of the World 18.2
             Less : Imports of goods and services from Rest of the World 29.8
             Net Exports 6.1
             Gross Regional Domestic Expenditure 7.2
BUSINESS AND INDUSTRY
(Source: ASPBI)
2020 p 
Number of establishments (Total employment with 20 or more workers)  
Agriculture and forestry/Agriculture, hunting and forestry/Agriculture, forestry and fishing 281
Mining and quarrying 12
Manufacturing 646
Electricity, gas, and water/electricity, gas, steam and air conditioning supply 27
Construction 50
Wholesale and retail trade, repair of motor vehicles, and motorcycles 3,646
Hotels and restaurants/Accommodation and food service activities 934
Transportation/Transport, storage and communications/Transport and storage 87
Financial intermediation/Financial and insurance activities 1,502
Real estate/Real estate, renting and business activities/Real estate activities 74
Professional, Scientific and Technical Activities
104
Education/Private education 475
Health and social work/ Human health and social work 168
Other community, social and personalservices/Other service activities 202
Water supply; sewerage, waste management and remediation activities 34
Arts entertainment and Recreation 137
Information and communication 99
Administrative and Support Activities 166
VITAL STATISTICS (Source: VSR) 2022 p
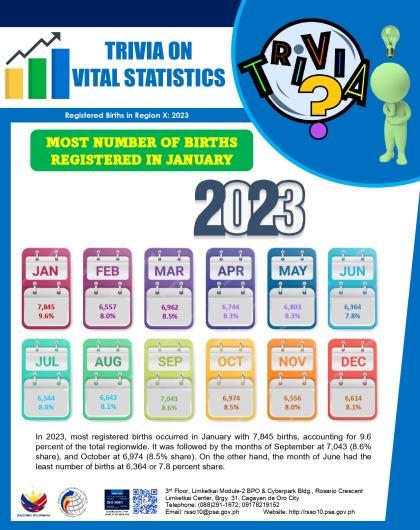
Registered birth 1/ (usual residence)  76,745
    Male 40,054
    Female 36,691
Registered marriages 1/ (at place of occurence) 22,500
Registered deaths 1/ (usual residence) 30,639
    Male 17,584
    Female 13,055
Infant deaths 1/ (usual residence) n.a.
    Male n.a.
    Female n.a.
Fetal deaths 1/ (usual residence) n.a.
POVERTY STATISTICS 2021 p
Annual Per Capita Poverty Threshold (in pesos)
28,836
Annual Per Capita Food/Subsistence Threshold (in pesos)
20,124
Poverty Incidence (in percent)
 
    Among Families 19.2
    Among Population 26.1
POVERTY STATISTICS 2018
    Among Women 22.9
    Among Children 31.6
    Among Youth 20.5
    Among Senior Citizens 12.4
    Among Individuals in Urban Areas
16.4
    Among Individuals in Rural Areas
28.8
    Among Migrants and Social Workers
14.8
    Among Farmers
34.2
    Among Fisherfolks
20.5
    Among Self-employed and unpaid family worker
21.6
    Among 15 years old and above with disability
16.2
Magnitude of Poor  (in thousands)
 
    Number of Poor Families
194.2
    Number of Poor Individuals
1,129.2
    Number of Poor Women
548.1
    Number of Poor Children
600.8
    Number of Poor Youth
292.5
    Number of Poor Senior Citizens
49.5
    Number of Poor Individuals Residing in Urban Areas
381.4
    Number of Poor Individuals Residing in Rural Areas
739.0
    Number of Poor Migrants and Social Workers
176.7
    Number of Poor Farmers
190.4
    Number of Fisherfolks
6.0
    Number of Poor Self-employed and unpaid family worker
135.7
    Number of Poor Persons aged 15 years old and above with disability
12.3
Subsistence Incidence (in percent)
2021 p
    Among Families
6.2
    Among Population
9.3
Subsistence Incidence 2018
    Among Women
5.9
    Among Children
8.9
    Among Youth
4.8
    Among Senior Citizens
1.9
    Among Individuals in Urban Areas
3.9
    Among Individuals in Rural Areas
7.6
    Among Migrants and Social Workers
3.3
    Among Farmers
10.1
    Among Fisherfolks
4.9
    Among Self-employed and unpaid family worker
6.0
    Among 15 years old and above with disability
3.1
Magnitude of Food Poor (in thousands)
 
    Number of Food Poor Families
43.3
    Number of Food Poor Individuals
289.9
    Number of Food Poor Women
140.6
    Number of Food Poor Children
169.2
    Number of Food Poor Youth
68.2
    Number of Food Poor Senior Citizens
7.7
    Number of Food Poor Individuals Residing in Urban Areas
91.7
    Number of Food Poor Individuals Residing in Rural Areas
195.7
    Number of Food Poor Migrants and Social Workers
39.7
Magnitude of Food Poor  (continued,,,,)
2018
    Number of Food Poor Farmers
56.1
    Number of Food Poor Fisherfolks
1.5
    Number of Food Poor Self-employed and unpaid family worker
37.6
    Number of Food Poor Persons aged 15 years old and above with disability
2.3
FAMILY INCOME AND EXPENDITURE
(Source: FIES)
(in thousand pesos, at current prices)
2018
Annual average family income 250
Annual average family expenditure 175
Annual average family saving 76
EDUCATION (Source: FLEMMS) 2019
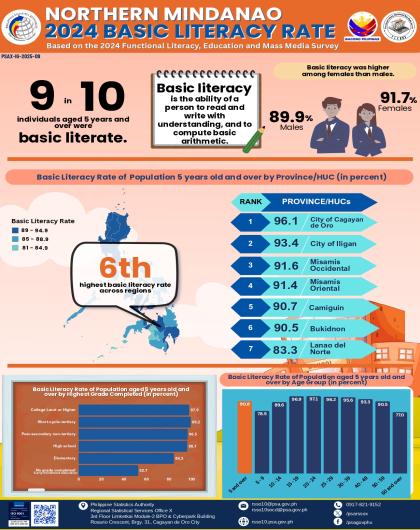
Basic literacy rate
(10 years old and over)2/
98.2
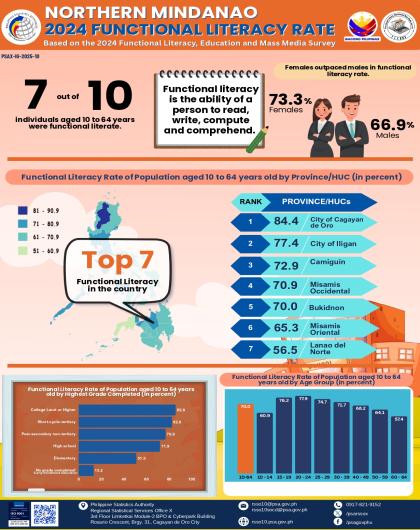
Functional literacy rate
(10 to 64 years old) 3/
95.4
FAMILY PLANNING
(Source: 2013 NDHS, 2017 NDHS and 2022 NDHS)
2022
Modern method 4/ 49.5
Traditional method 4/ 8.8
DEMOGRAPHY (Source: CPH) 2020
Total Population 5,022,768
    Urban
2,528,239
    Rural 2,494,529
    Male 2,566,715
    Female 2,456,053
    0-14 years 1,655,937
    15-64 years 3,119,646
    65 years and over 247,185
Density
(persons per square kilometer)
246
Average household size 4.2
  2015-2020
Growth rate 1.46
  2024
Population projection 5/
5,228,550

1/ -Source: 2010 Census-Based National, Regional and Provincial Population Projections
2/ -Based on civil registration. Not adjusted for underregistration.
3/ -Based on currently married women aged 15-49 years.
4/ -Basic reading and writing skills.
5/ -Basic reading, writing, and computational skills.
6/ -Estimates are preliminary and may change. Figures were estimated using the 2000 Census-based Population Projections.
7/ -Source: Survey on Overseas Filipinos.
8/ -Based on Household Population.
9/ -Based on Actual Population.
10/-Based on Census of Philippine Business and Industry.
11/ -Based on Population Growth Rate 2000-2010.
12/ -Based on Population Growth Rate 2010-2015.
13/ -Place of occurence.
r/ -Revised.
p/ -Preliminary.
* -Quantity less than 0.5 tons.
..- Data Not Available
(-) - No Transaction
S – Data suppressed.
CPBI – Census of Philippine Business and Industry.
CPH – Census of Population and Housing.
ASPBI – Annual Survey of Philippine Business and Industry.
NDHS – National Demographic and Health Survey.
FHS – Family Health Survey.
FPS – Family Planning Survey.
FLEMMS - Functional Literacy, Education, and Mass Media Survey
FIES - Family Income and Expenditure Survey
LFS – Labor Force Survey.
VSR – Vital Statistics Report.
n.a. - not yet available.
a – no quantity
b - no value


Latest Infographics

Latest Publication

2022 PSA AwardsPSA 10th AnniversaryRepublic Act No. 11909CRS Appointment Slip FreeRDC Xcellence 2022 Amihanan AwardsFirst Time Jobseekers Assistance ActePhilIDBirth Certificate Problem and SolutionsVerify PhilsysPSA Serbilis

Latest Releases

PSAX-PR-2023-26
September 26, 2023
Mr. Jonathan R. Agbayani, Senior Science Research Specialist of the Department of Science and Technology – X, is advancing to the national finals of the 3rd PSA Quiz Bee after winning First Place during the Regional Eliminations conducted on 25 September 2023 at Chali Beach Resort and Conference Center, Cagayan de Oro City.
 
PSAX-PR-2023-24
September 15, 2023

The Philippine Statistics Authority (PSA) announced that the registration of the Philippine Identification System (PhilSys) in Region 10 has reached 88% completion which is equivalent to 3,924,386 out of 4,461,503 target individual as of August 31, 2023.  This is a significant milestone in the implementation of the national ID system, which aims to provide a valid proof of identity for all Filipinos and resident

PSAX-PR-2023-25
September 15, 2023

The Philippine Statistics Authority (PSA) and the Department of Migrant Workers (DMW) have signed a Memorandum of Agreement (MOA) to facilitate the registration of overseas Filipino workers (OFWs) to the Philippine Identification System (PhilSys). The MOA aims to ensure that OFWs have access to the national ID system, which will serve as a valid proof of identity and a platform for digital transactions.

PSAX-PR-2023-23
September 12, 2023
The Philippine Statistics Authority - Regional Statistical Services Office X (PSA-RSSO X) commemorates the PSA 10th Anniversary on 05 September 2023. The event began with a Grand Caravan around the city, attended by the PSA stakeholders, followed by the unveiling of the PSA Exhibit in the Second Floor of Limketkai Mall, and a program at the Mallberry Suites Business Hotel in Cagayan de Oro City. 
PSAX-SR-2023-15
September 7, 2023

Northern Mindanao

Regional inflation increased to 5.0 percent in August 2023, from 4.0 percent in the previous month. The inflation rate in August 2022 was higher at 6.6 percent. (Table A and Figure 1)

Table A. Year-on-Year Inflation Rates for All Items, Northern Mindanao:
August 2022, July 2023, and August 2023
(In percent, 2018=100)

PSAX-PR-2023-22
September 6, 2023

The Census of Agriculture and Fisheries (CAF) that is conducted every 10 years, is a large-scale government undertaking geared towards the collection and compilation of basic information on the agricultural and fishery sectors in the country. The 2022 CAF with the reference period starting January 01, 2022 to December 31, 2022, is the seventh in the series of decennial agricultural census and sixth in the

Pages

Transparency Seal

Transparency Seal

arta

ISO Certification

Civil Registration Corner


Request a birth, marriage, death certificate, or CENOMAR delivered anywhere in the Philippines or abroad. Click below!

CRS Appointment System

Fast & Hassle Free Certificate Delivery

Philippine Identification System


Click here for PhilSys Registration Center


For comments and suggestions,
please feel free to reach info@philsys.gov.ph or hotline 1388.

Connect with Us!