Northern Mindanao All Income Households
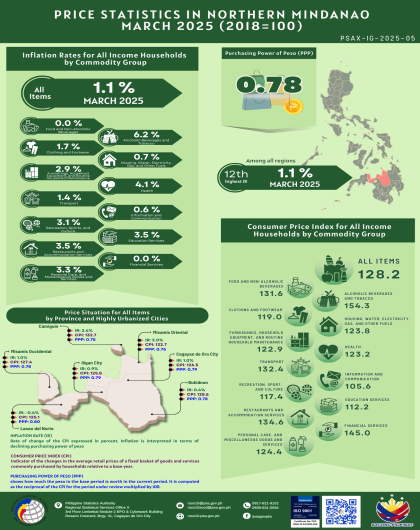
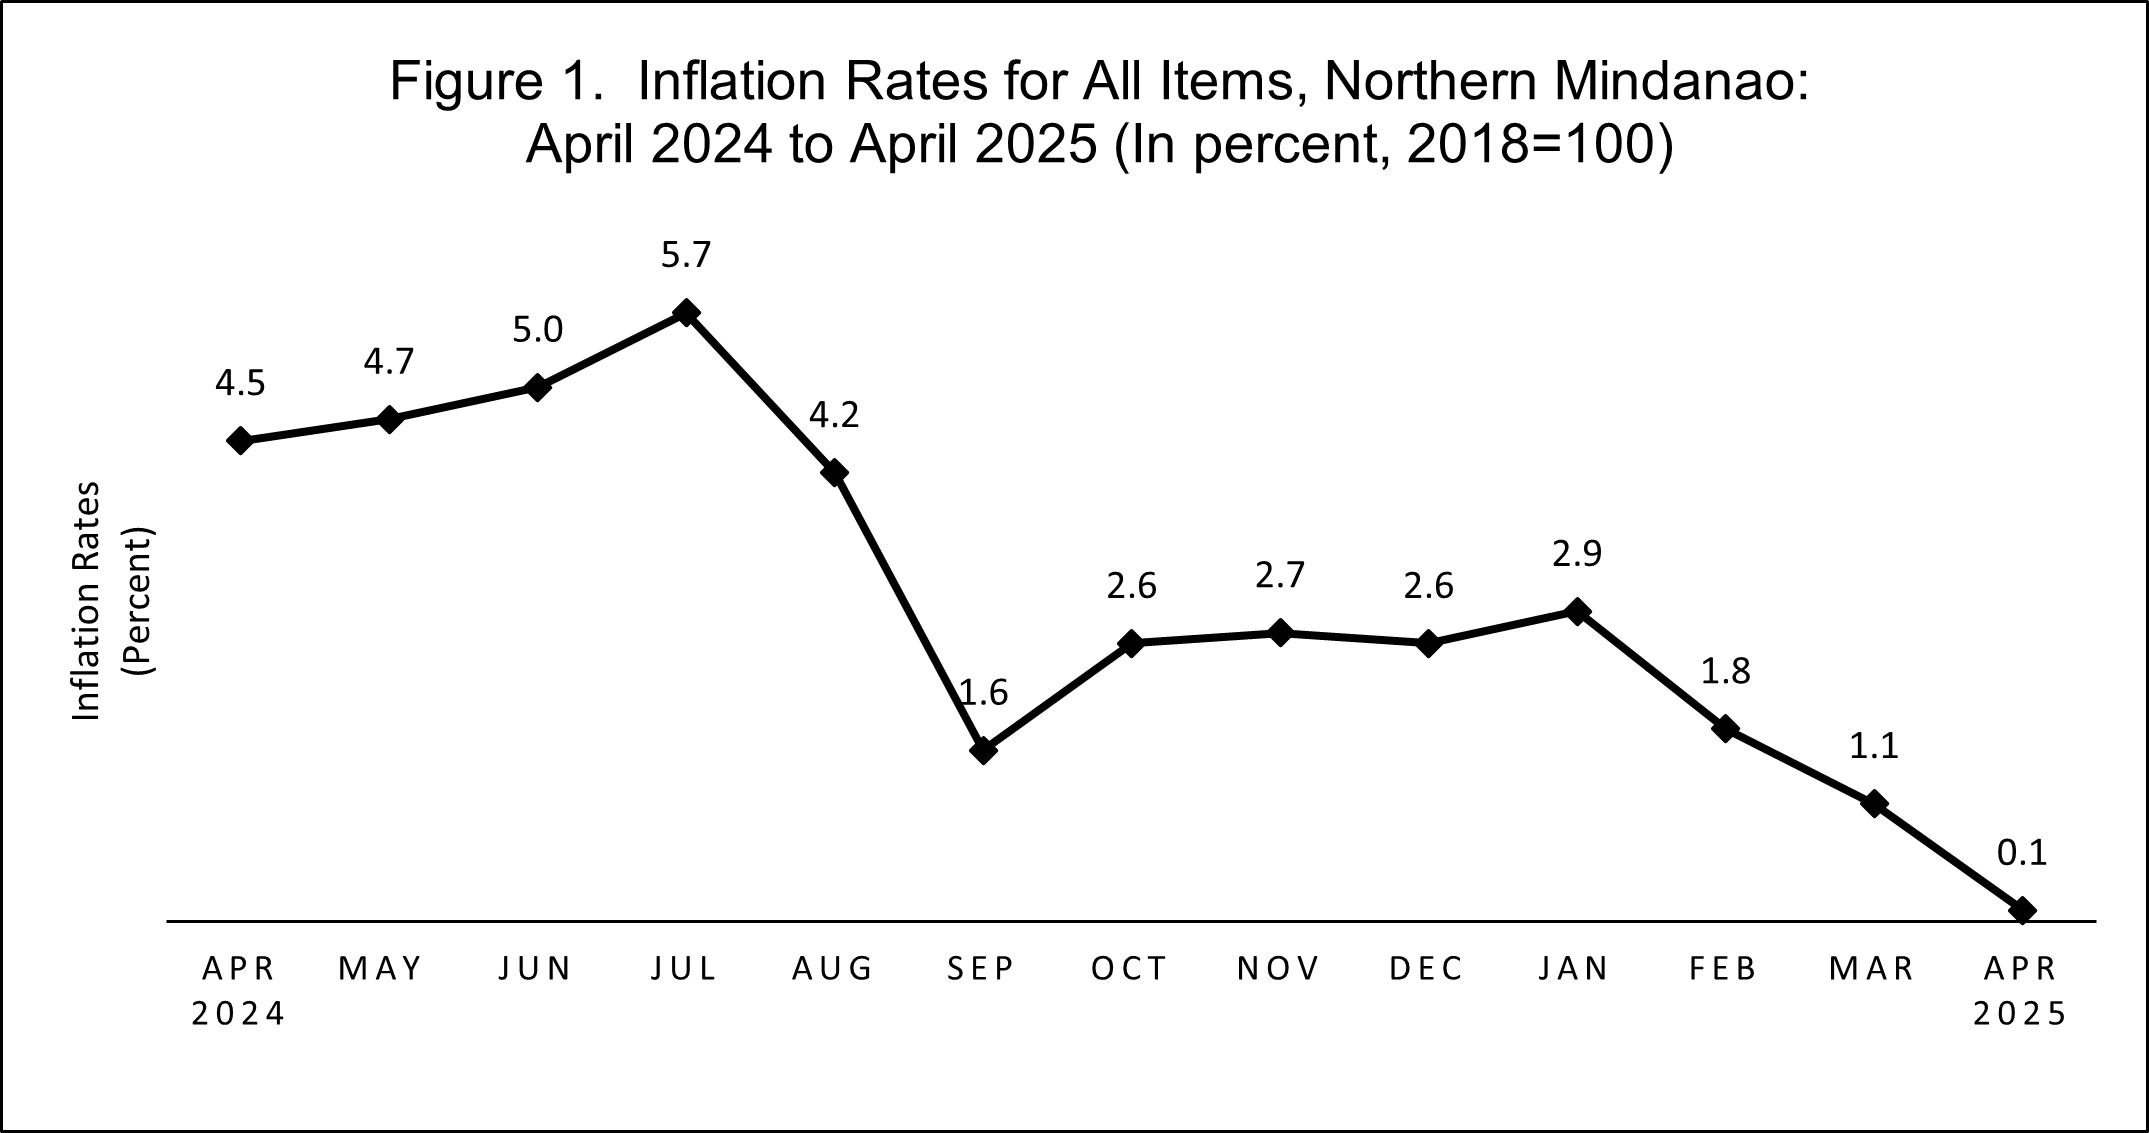
Inflation in Northern Mindanao decreased to 0.1 percent in April 2025 from 1.1 percent in the previous month. The inflation rate in April 2024 was higher at 4.5 percent. (Table A and Figure 1)
All Items
As shown in the table below, all the provinces and HUCs of Northern Mindanao recorded lower inflation rates in April 2025 compared to the previous month. Cagayan de Oro City (34.1%) is the major contributor to the downtrend in the regional inflation rate for April 2025. On a year-on-year basis, all areas in the region also registered lower inflation rates compared to April 2024.
Table A. Year-on-Year Inflation Rates for All Items, Northern Mindanao:
April 2024, March 2025, and April 2025
(In percent, 2018=100)
| Area | April 2024 | March 2025 | April 2025 |
| Philippines | 3.8 | 1.8 | 1.4 |
| Region X | 4.5 | 1.1 | 0.1 |
| Bukidnon | 5.5 | 0.4 | - 0.7 |
| Camiguin | 4.1 | 2.4 | 1.3 |
| Lanao del Norte | 5.5 | - 0.4 | - 0.9 |
| Misamis Occidental | 3.4 | 1.0 | 0.7 |
| Misamis Oriental | 4.6 | 3.0 | 1.8 |
| Iligan City | 3.8 | 0.9 | 0.2 |
| Cagayan de Oro City | 4.0 | 1.0 | - 0.4 |
Source: Retail Price Survey of Commodities for the Generation of Consumer Price Index,
Philippine Statistics Authority.
Source: Retail Price Survey of Commodities for the Generation of Consumer Price Index,
Philippine Statistics Authority.
By Commodity Group
In April 2025, the following commodity groups recorded lower month-on-month inflation (Table B):
- food and non-alcoholic beverages at -2.0 percent;
- alcoholic beverages and tobacco at 5.1 percent;
- furnishings, household equipment, and routine household maintenance at 2.3 percent;
- health at 4.0 percent;
- transport at -0.6 percent; and
- recreation, sports, and culture at 2.1 percent.
In contrast, inflation recorded higher in:
- housing, water, electricity, gas, and other fuels at 1.2 percent;
- information and communication at 0.8 percent;
- restaurants and accommodation services at 4.5 percent; and
- personal care, and miscellaneous goods and services at 3.4 percent.
Meanwhile, clothing and footwear, education services, and financial services recorded no changes in their inflation rates.
Food and non-alcoholic beverages with 79.2 percent share was the major contributor to the slowdown in inflation this month.
Table B. Inflation Rate by Commodity Group for All Income Households,
Northern Mindanao: April 2024, March 2025, and April 2025
(In percent, 2018=100)
| Commodity Group | April 2024 | March 2025 | April 2025 |
| All Items | 4.5 | 1.1 | 0.1 |
| Food and Non-Alcoholic Beverages | 7.9 | 0.0 | - 2.0 |
| Alcoholic Beverages and Tobacco | 7.2 | 6.2 | 5.1 |
| Clothing and Footwear | 2.8 | 1.7 | 1.7 |
| Housing, Water, Electricity, Gas, and Other Fuels | - 0.3 | 0.7 | 1.2 |
Furnishings, Household Equipment, and Routine Household Maintenance | 5.8 | 2.9 | 2.3 |
| Health | 3.0 | 4.1 | 4.0 |
| Transport | 4.0 | 1.4 | - 0.6 |
| Information and Communication | 0.7 | 0.6 | 0.8 |
| Recreation, Sport, and Culture | 3.9 | 3.1 | 2.1 |
| Education Services | 2.5 | 3.5 | 3.5 |
| Restaurants and Accommodation Services | 1.2 | 3.5 | 4.5 |
| Financial Services | - 0.1 | 0.0 | 0.0 |
Personal Care and Miscellaneous Goods and Services | 2.8 | 3.3 | 3.4 |
| Source: Retail Price Survey of Commodities for the Generation of Consumer Price Index, Philippine Statistics Authority. | |||
Regional food inflation slowed down in April 2025, registering a further decline to -2.4 percent from -0.2 percent in the previous month. (Table C.)
Almost all sub-classes within the food commodity group experienced a deceleration in inflation rates during the month. The only exception was oils and fats at 0.6 percent from 0.5 percent in March 2025.
Moreover, the inflation of cereals decelerated in April 2025 at -11.4 percent, while flour, bread and other bakery products, pasta products, and other cereals accelerated at 1.6 percent. Further, the inflation of rice and corn decelerated at -13.5 percent and -1.2 percent, respectively.
The major contributor to the slowdown in inflation of the food commodity group
was cereals and cereal products with 80.5 percent.
Table C. Inflation Rate of Food Items for All Income Households by Commodity Group,
Northern Mindanao: April 2024, March 2025, and April 2025
(In percent, 2018=100)
| Commodity Group | April 2024 | March 2025 | April 2025 |
| Food | 8.3 | - 0.2 | - 2.4 |
| Cereals and Cereal Products | 21.4 | - 4.8 | - 9.2 |
| Cereals | 25.5 | - 6.1 | - 11.4 |
| Rice | 30.3 | - 7.5 | - 13.5 |
| Corn | 6.3 | 0.8 | - 1.2 |
| Flour, Bread and Other Bakery Products, Pasta Products, and Other Cereals | 4.3 | 1.0 | 1.6 |
Meat and Other Parts of Slaughtered Land Animals | - 1.1 | 5.6 | 5.4 |
| Fish and Other Seafood | 1.1 | - 2.2 | - 3.7 |
| Milk, Other Dairy Products, and Eggs | 4.4 | 7.1 | 6.3 |
| Oils and Fats | 1.9 | 0.5 | 0.6 |
| Fruits and Nuts | 13.7 | 10.7 | 9.2 |
Vegetables, Tubers, Plantains, Cooking Bananas, and Pulses | - 2.1 | 1.1 | 1.0 |
| Sugar, Confectionery, and Desserts | - 1.7 | 1.3 | 0.1 |
Ready-Made Food and Other Food Products N.E.C. | 4.9 | 1.1 | 0.5 |
Source: Retail Price Survey of Commodities for the Generation of Consumer Price Index, Philippine Statistics Authority. | |||
Provincial/HUCs Food Items Inflation Rates
All provinces and highly urbanized cities (HUCs) in Northern Mindanao recorded slower food inflation rates in April 2025 compared to the previous month, reflecting a widespread easing of food price pressures across the region. (Table D.)
On a year-on-year basis, all provinces and HUCs posted lower food inflation rates compared to April 2024.
Cagayan de Oro City made the largest contribution of 32.7 percent share to the overall deceleration of food inflation in Northern Mindanao.
Table D. Inflation Rate of Food Items for All Income Households by Province/HUC,
Northern Mindanao: April 2024, March 2025, and April 2025
(In percent, 2018=100)
| Area | April 2024 | March 2025 | April 2025 |
| Region X | 8.3 | - 0.2 | - 2.4 |
| Bukidnon | 9.7 | 0.6 | - 2.1 |
| Camiguin | 9.1 | 0.5 | - 1.0 |
| Lanao del Norte | 7.4 | - 1.0 | - 1.7 |
| Misamis Occidental | 3.7 | - 0.1 | - 0.5 |
| Misamis Oriental | 8.8 | 1.7 | - 0.9 |
| Iligan City | 6.1 | 1.1 | - 0.1 |
| Cagayan de Oro City | 10.8 | - 3.1 | - 6.8 |
| Source: Retail Price Survey of Commodities for the Generation of Consumer Price Index, Philippine Statistics Authority. | |||
Northern Mindanao Bottom 30% Income Households
The regional inflation rate for the bottom 30% income households dropped to -0.4 percent in April 2025, down from 0.9 percent in the previous month. This is slower compared to the 5.7 percent inflation rate recorded in April 2024.
The primary driver behind this downtrend was food and non-alcoholic beverages, which contributed 78.1 percent to the overall decline in inflation in April 2025.
In particular, regional food inflation for the bottom 30% income households fell further to -2.4 percent in April 2025 from -0.5 percent in March. This is a slowdown from the 8.9 percent food inflation rate seen in the same month last year, highlighting the substantial easing of food-related price pressures for the bottom 30% income households.
For the Regional Director:
(SGD.)JOSE B. TUASON, JR.
(Registration Officer IV)
Officer-in-Charge, PSA 10
SBB/ASC/ANC
For further inquiries, you may contact:
Statistical Operations and Coordination Division
Philippine Statistics Authority Regional Statistical Service Office 10
Limketkai Module-2 BPO & Cyberpark Bldg.,
Rosario Crescent, Limketkai Center, Cagayan de Oro City
Email: rsso10@psa.gov.ph
Telephone: (088) 291 1672; 0917 821 915
TECHNICAL NOTES
Consumer Price Index (CPI) – The CPI is an indicator of the changes in the average retail prices of a fixed basket of goods and services commonly purchased by households relative to a base year.
Used of CPI – CPI is most widely used in the calculation of the inflation rate and purchasing power of peso. It is a major statistical series used for economic analysis and as a monitoring indicator of government economic policy.
Computation of CPI – The computation of the CPI involves consideration of the following important points:
- Base Period – The reference data or base period is the benchmark or reference date or period at which the index is taken as equal to100.
- Market Basket – A sample of the thousands of varieties of goods purchased for consumption and services availed by the households in the country selected to represent the composite price behavior of all goods and services purchased by consumers.
- Weighing System – The weighing pattern uses the expenditures on various consumer items purchased by households as a proportion to total expenditure.
- Formula – The formula used in computing the CPI is the weighted arithmetic mean of price relatives, the Laspeyre’s formula with a fixed base year period (2018) weights.
- Geographic Coverage – CPI values are computed at the national, regional, and provincial levels, and for selected cities.
Inflation Rate (IR) – is the rate of change of the CPI expressed in percent. Inflation is interpreted in terms of declining purchasing power of peso.
Purchasing Power of Peso (PPP) – shows how much the peso in the base period is worth in the current period. It is computed as the reciprocal of the CPI for the period under review multiplied by 100.