

Release Date :
Reference Number :
PSAMISOR-SR-2023-21
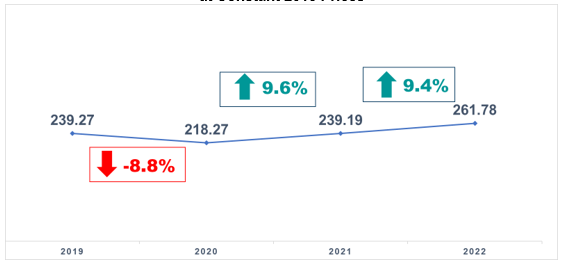
The economy of the City of Cagayan de Oro further expanded by 9.4 percent in 2022. Such expansion, however, is slower than the 9.6 percent growth posted in the previous year. The recorded growth in 2022 translates to a Gross Domestic Product (GDP) of the city valued at PhP 261.78 billion, which surpassed the 2019 pre-pandemic level of PhP 239.27 billion. This is an indication that the city recovered from the economic losses caused by the pandemic. (Figure 1)
Figure 1. Gross Domestic Product of the City of Cagayan de Oro, 2019 to 2022
Levels (in Billion PhP) and Growth Rates (in Percent)
at Constant 2018 Prices
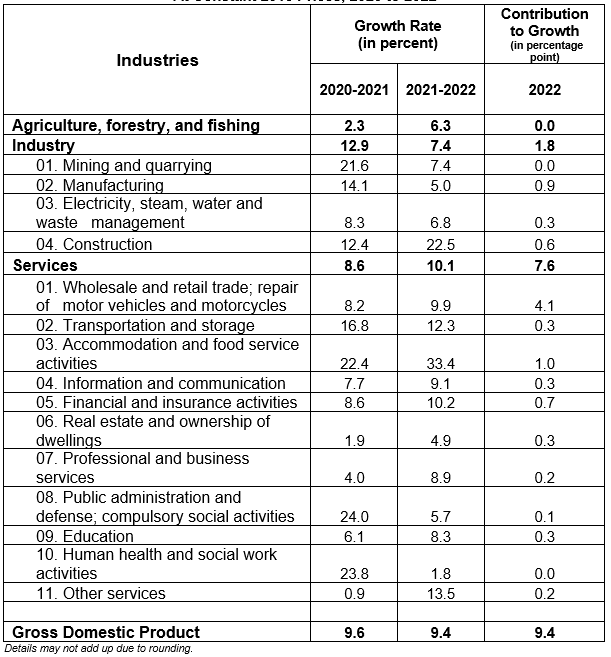
Major industries with accelerated growths were Agriculture, forestry and fishing which registered an increase of 6.3 percent from 2.3 percent in the previous year and Services which grew by 10.1 percent from 8.6 percent in the previous year. Industry, on the other hand, slowed down to 7.4 percent growth rate from 12.9 percent in 2021. (Table 1)
The top contributors to the 9.4 economic growth were Wholesale and retail trade; repair of motor vehicles and motorcycles contributing 4.1 percentage points, Accommodation and food service activities with a contribution of 1.0 percentage point, Manufacturing with 0.9 percentage point contribution, Financial and insurance activities with 0.7 percentage point, and Construction which contributed 0.6 percentage point. (Table 1)
On the other hand, the three fastest growing industries were Accommodation and food service activities which posted 33.4 percent growth, followed by Construction with an increase of 22.5 percent, Other services with 13.5 percent, Transportation and storage (12.3%), and Financial and insurance activities (10.2%)
Table 1. Gross Domestic Product of the City of Cagayan de Oro, by Industry
Growth Rate (in Percent), Contribution to Growth (in percentage point)|
At Constant 2018 Prices, 2020 to 2022
Structure of the Economy
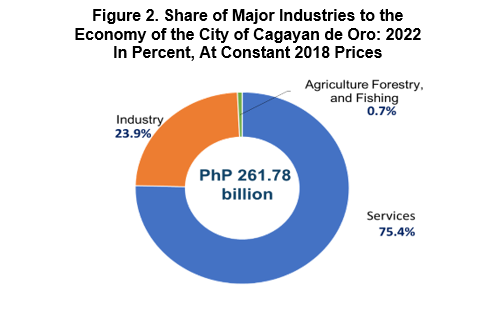
The economy of the city is predominantly Services-based whose share is 75.4 percent. Industry ranked second in terms of share with a share of 23.9 percent. Meanwhile, Agriculture, forestry, and fishing accounted for the least part of the economy, that is, 0.7 percent. (Figure 2)
Figure 2. Share of Major Industries to the
Economy of the City of Cagayan de Oro: 2022
In Percent, At Constant 2018 Prices
Whole and retail trade; repair of motor vehicles and motorcycles consisted the major share of 41.3 percent of the total economy of the city. The other large industries were Manufacturing (16.7%) and Financial and insurance activities (6.8%). These 3 largest industries accounted for 64.8 percent of the economy of the city. (Figure 3)
Figure 3. Share of Industries to the Economy of the
City of Cagayan de Oro: 2022
In Percent, At Constant 2018 Prices
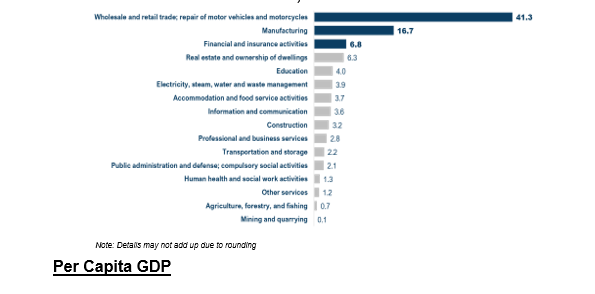
Per Capita GDP
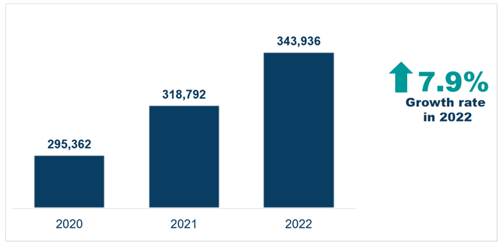
The GDP value contributed by each individual in the city is described by the per capita GDP. The per capita GDP of Cagayan de Oro increased by 7.9 percent translating to a per capita GDP value of PhP 343,936. (Figure 4)
Figure 4. Per Capita GDP of the City of Cagayan de Oro: 2020-2022
Level), Growth Rate (in percent)
At Constant 2018 Prices
City of Cagayan de Oro vis-à-vis Other Economies in Northern Mindanao
The city registered as the fastest growing economy in the region in 2022 (Figure 5). It also accounted for the largest share of 28.0 percent among the seven economies of Northern Mindanao (Figure 6).
Likewise, in Agriculture, Forestry and Fishing (AFF), the city of Cagayan de Oro posted the fastest growth (Figure 7). However, in terms of share to AFF, the city accounted for the fifth largest share of 1.0 percent of the total AFF in the region (Figure 8).
Despite the city’s slowdown in Industry, it still outperformed the other 5 economies in terms of growth rate in Industry (Figure 9). Moreover, the city accounted for the second largest share in the total Industry of Region X at 26.2 percent (Figure 10).
For Services, the city recorded the 3rd fastest increase among the seven economies. The city’s growth in Services (10.13%) was faster than the regional average growth of 10.07 percent. (Figure 11)
Figure 5. Gross Domestic Product of Northern Mindanao, by Province/HUC
Growth Rate (in Percent), 2021 to 2022
at Constant 2018 Prices
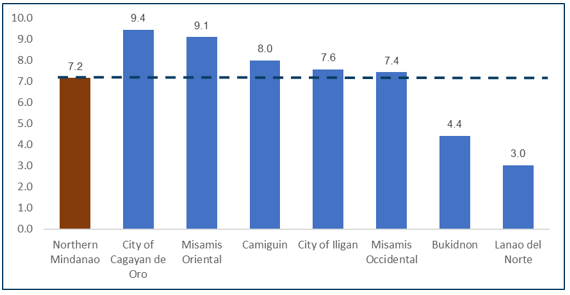
Figure 6. Share of Economies to the Gross Regional Domestic Product
of Northern Mindanao: 2022
Share (in Percent), at Constant 2018 Prices
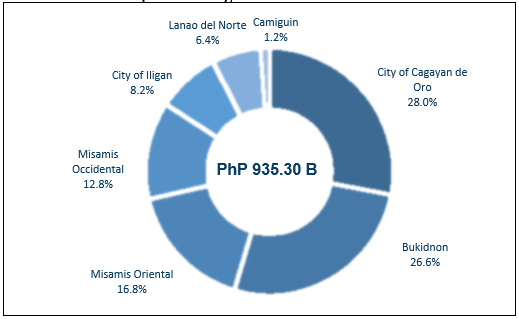
Figure 7. Gross Value Added in Agriculture, Forestry, and Fishing
of Northern Mindanao, by Province/HUC
Growth Rate (in Percent), 2021 to 2022
at Constant 2018 Prices
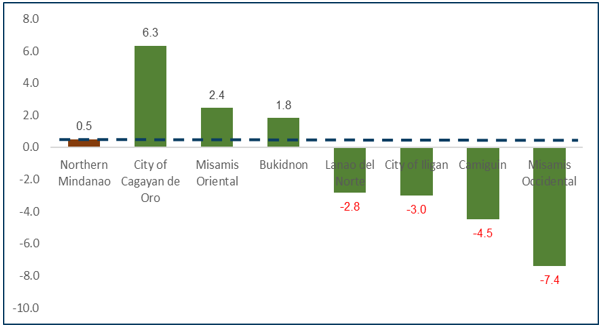
Figure 8. Share of Economies to 2022 Agriculture, Forestry, and Fishing
of Northern Mindanao: 2022
Share (in Percent), at Constant 2018 Prices
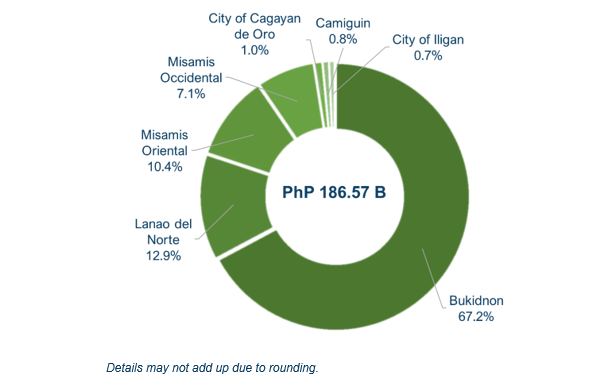
Figure 9. Gross Value Added in Industry of Northern Mindanao,
by Province/HUC
Growth Rate (in Percent), 2021 to 2022
at Constant 2018 Prices
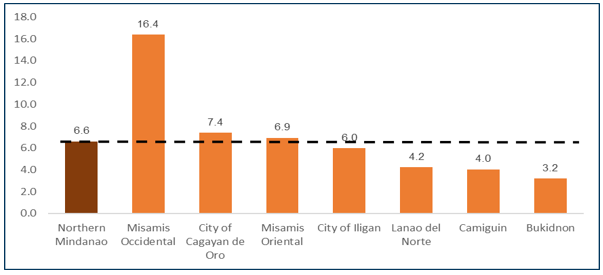
Figure 10. Share of Economies to 2022 Industry of Northern Mindanao: 2022
Share (in Percent), at Constant 2018 Prices
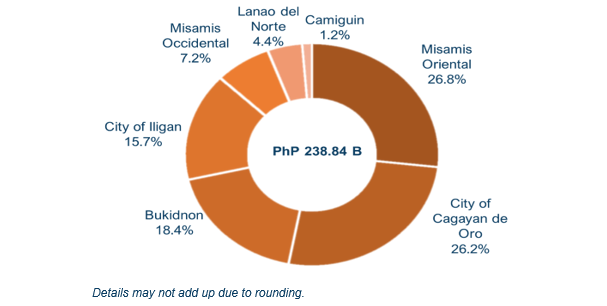
Figure 11. Gross Value Added in Services of Northern Mindanao,
by Province/HUC
Growth Rate (in Percent), 2021 to 2022
at Constant 2018 Prices
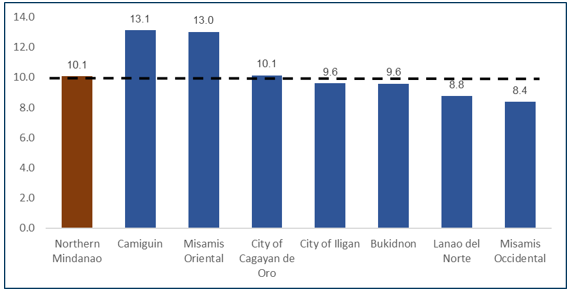
Figure 12. Share of Economies to 2022 Services of Northern Mindanao: 2022
Share (in Percent), at Constant 2018 Prices
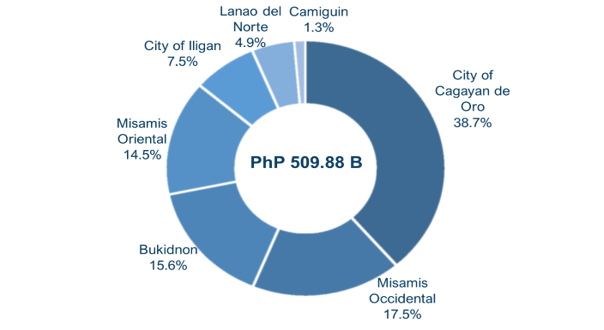
In terms of share to Services in Region X, the city of Cagayan de Oro accounted for the largest share of 38.7 percent. (Figure 12)
Figure 13. Per Capita GDP of the Economies in Region X: 2022
In Thousand Pesos, at Constant 2018 Prices
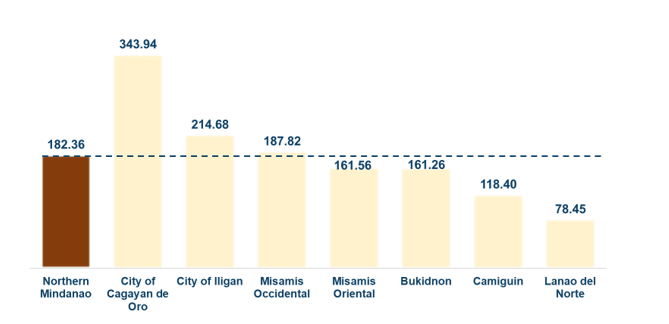
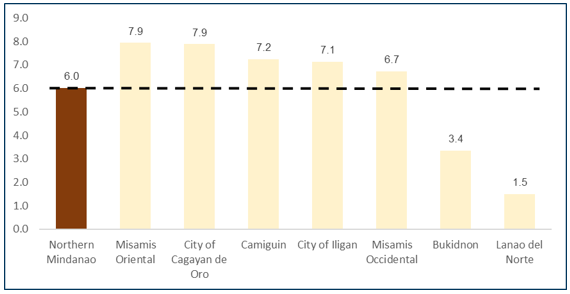
The city also recorded the highest per capita GDP of PhP 343.94 thousand pesos, higher by 88.6 percent of the average regional per capita GDP (Figure 13). The per capita GDP describes the individual contribution of the residents within the economy. In terms of per capita GDP growth rate, the city posted the second fastest growth rate in per capita GDP among the seven economies. (Figure 14)
Figure 14. Per Capita GDP of the Economies in Region X
Growth Rate (in Percent), 2021 to 2022
At Constant 2018 Prices
The Provincial Product Accounts or PPA is a mechanism of the PSA to compile the annual estimates of Gross Domestic Product by province and highly urbanized cities, consistent with the National and Regional Accounts of the Philippines. In 2023, a PPA for 82 provinces and 17 highly urbanized cities is compiled for monitoring economic performance at the local level. The city of Cagayan de Oro started its PPA compilation since 2021.
Full statistical tables and visuals can be accessed via the PSA website at https://psa.gov.ph/statistics/ppa and the PSA Misamis Oriental Facebook Page at https://www.facebook.com/PSAMISOR.
MARIA LIZA M. BIGORNIA
(Chief Statistical Specialist)
Officer-in-Charge
| Attachment | Size |
|---|---|
|
|
903.57 KB |
|
|
25.61 KB |
|
|
27.87 KB |