

Release Date :
Reference Number :
PSALDN-SR-2023-10
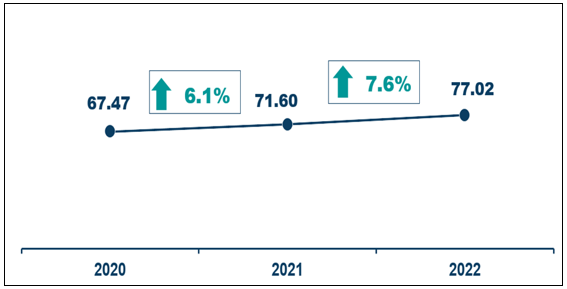
The Gross Domestic Product (GDP) of the City of Iligan increased on an accelerated rate of 7.6 percent in 2022 bringing its GDP value at PhP 77.02 billion. (Figure 1)
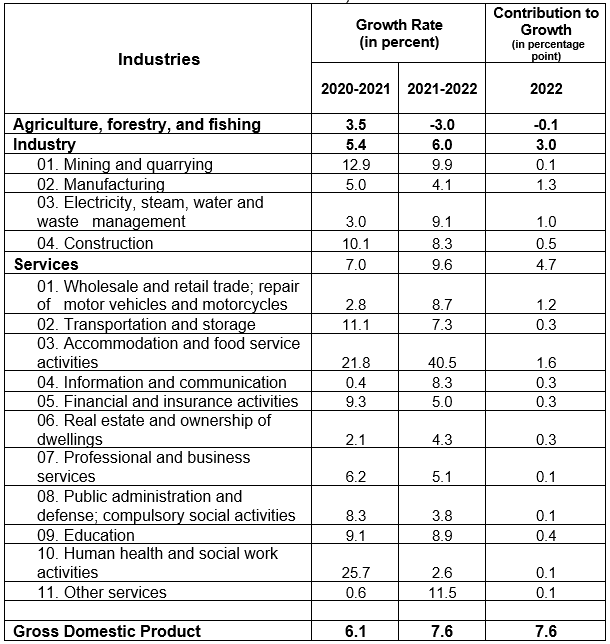
The accelerated growth was mainly attributed to the faster expansion in Services at 9.6 percent from 7.0 percent and in Industry which posted a higher increase of 6.0 percent from 5.4 percent. (Table 1)
Figure 1. Gross Domestic Product of the City of Iligan: 2020 to 2022
Levels (in Billion PhP) and Growth Rates (in Percent)
at Constant 2018 Prices
The largest contributors to the 7.6 economic growth were Accommodation and food service activities with 1.6 percentage point contribution, followed by Manufacturing which contributed 1.3 percentage points, Wholesale and retail trade; repair of motor vehicles and motorcycles contributed 1.2 percentage points, Electricity, steam, water, and waste management which contributed 1.0 percentage point, and Construction with 0.5 percentage point. (Table 1)
The 5 fastest growing industries were Accommodation and food service activities (40.5%), Other services (11.5%), Mining and Quarrying (9.9%), Electricity, steam, water, and waste management (9.1%), and Education (8.9%). (Table1)
Table 1. Gross Domestic Product of the City of Iligan, by Industry
Growth Rate (in Percent), Contribution to Growth (in percentage point)
At Constant 2018 Prices, 2020 to 2022
Structure of the Economy
The economy of the city is predominantly Services-based. Services shared 49.5 percent of the city’s economy, followed by Industry accounting for 48.8 percent, and Agriculture, Forestry, and Fishing sharing 1.7 percent. (Figure 2)
Figure 2. Share of Major Industries to the Economy
of the City of Iligan: 2022
In Percent, At Constant 2018 Prices
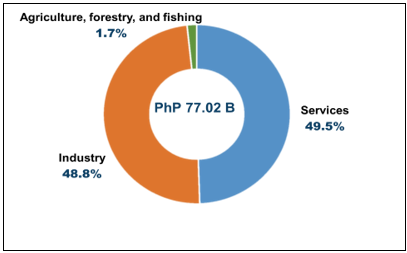
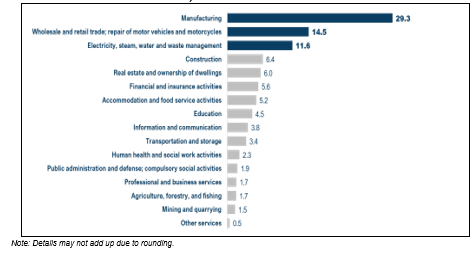
Figure 3 shows the shares of the industries to the city’s GDP. Manufacturing got the biggest chunk of the economy with 29.3 percent share. Wholesale and retail trade got the second biggest share of 14.5 percent. The third biggest chunk was in Electricity, steam, water, and waste management of 11.6 percent share. These 3 largest industries accounted for 55.4 percent of the city’s economy.
Figure 3. Share of Industries to the Economy of the City of Iligan: 2022
In Percent, At Constant 2018 Prices
Per Capita GDP
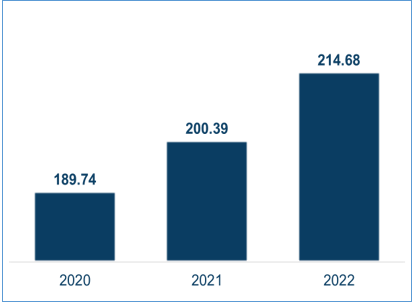
The GDP value contributed by each individual in the province is described by the per capita GDP. The per capita GDP of the City of Iligan increased by 7.1 percent, faster than the recorded increase in per capita GDP of 5.6 percent in the previous year. The accelerated growth brought the city’s per capita GDP at a value of PhP 214.68 thousand. (Figure 4)
Figure 4. Per Capita GDP of the City of Iligan: 2020-2022
Level (in thousand PhP), At Constant 2018 Prices
City of Iligan vis-à-vis Other Economies in Northern Mindanao
The City of Iligan was one of the 5 economies in the region which grew faster than the regional economic growth of 7.2 percent. It also recorded as the 4th fastest growing economy in the region. (Figure 5)
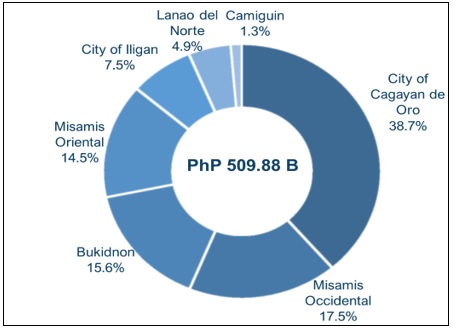
Moreover, the city accounted for the 5th largest share of 8.2 percent to the Gross Regional Product of Region X. (Figure 6)
In Agriculture, Forestry and Fishing (AFF), the city was one of the 4 economies in the region which posted a decline. (Figure 7)
In terms of share to AFF, the City of Iligan had the smallest share of 0.7 percent to the total AFF of the region. (Figure 8)
Figure 5. Gross Domestic Product of Northern Mindanao, by Province/HUC
Growth Rate (in Percent), 2021 to 2022
at Constant 2018 Prices
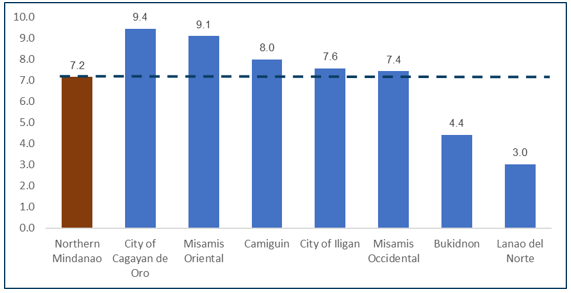
Figure 6. Share of Economies to the Gross Regional Domestic Product
of Northern Mindanao: 2022
Share (in Percent), at Constant 2018 Prices
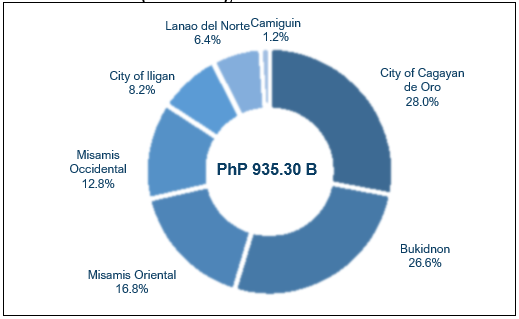
Figure 7. Gross Value Added in Agriculture, Forestry, and Fishing
of Northern Mindanao, by Province/HUC
Growth Rate (in Percent), 2021 to 2022
at Constant 2018 Prices
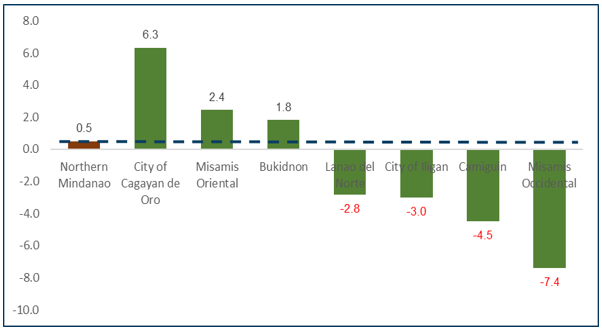
Figure 8. Share of Economies to 2022 Agriculture, Forestry, and Fishing
of Northern Mindanao: 2022
Share (in Percent), at Constant 2018 Prices
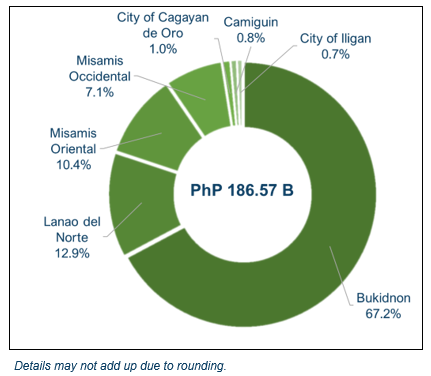
Figure 9. Gross Value Added in Industry of Northern Mindanao,
by Province/HUC
Growth Rate (in Percent), 2021 to 2022
at Constant 2018 Prices
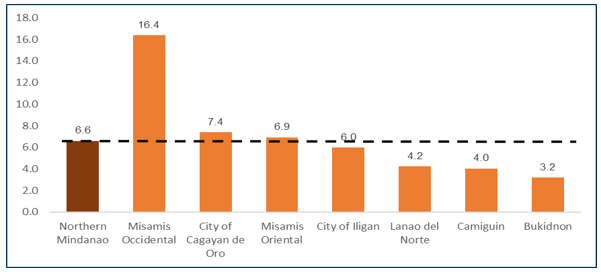
In Industry, the city increased at a rate slower than the regional average growth of 6.6 percent. It posted the 4th fastest increase in Industry among the seven economies of the region. (Figure 9)
In terms of Industry share, the city had the 4th biggest industry share of 15.7 percent. (Figure 10)
Figure 10. Share of Economies to 2022 Industry of Northern Mindanao: 2022
Share (in Percent), at Constant 2018 Prices
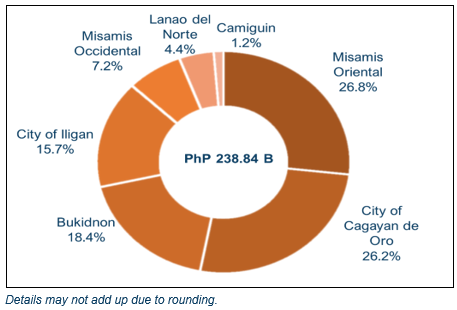
Figure 11. Gross Value Added in Services of Northern Mindanao,
by Province/HUC
Growth Rate (in Percent), 2021 to 2022
at Constant 2018 Prices
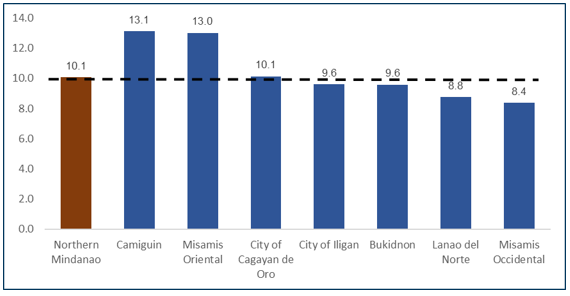
The city also posted slower growth in Services as compared to the regional average growth of 10.1 percent. It ranked 4th among the seven economies in terms of growth rate in Services. (Figure 11)
Figure 12. Share of Economies to 2022 Services of Northern Mindanao: 2022 Share (in Percent), at Constant 2018 Prices
In terms of share to Services in Region X, the city accounted for the 5th largest share of 7.5 percent. (Figure 12)
Figure 13. Per Capita GDP of the Economies in Region X: 2022
In Thousand Pesos, at Constant 2018 Prices
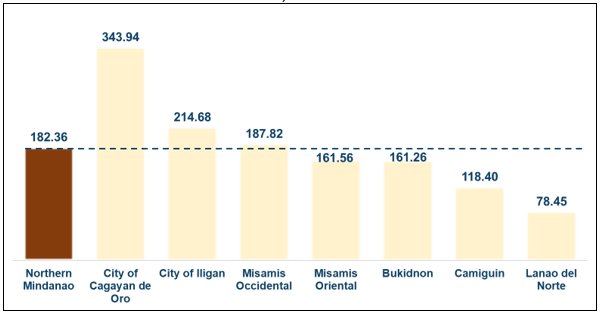
In terms of per capita GDP, the City of Iligan was one of the three economies which posted higher per capita GDP than the regional per capita GDP at 182.36 thousand pesos. The city’s per capita GDP was 17.7 percent higher than the regional per capita GDP. The 214.68 thousand pesos per capita GDP of the city was the 2nd highest per capita GDP among the economies in the region, next to the City of Cagayan de Oro. (Figure 13)
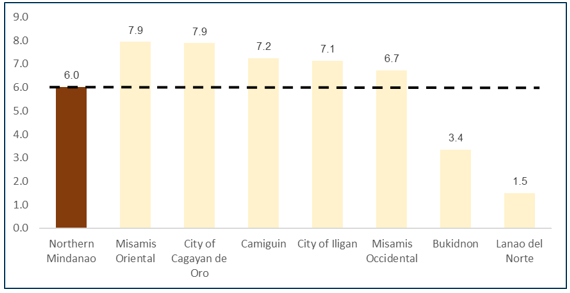
In terms of per capita GDP growth rate, the city recorded a faster growth rate than the regional average of 6.0 percent and posted as the 4th highest increase in per capita GDP among the seven economies. (Figure 14)
The Provincial Product Accounts or PPA is a mechanism of the PSA to compile the annual estimates of Gross Domestic Product by province and highly urbanized cities, consistent with the National and Regional Accounts of the Philippines. In 2023, a PPA for 82 provinces and 17 highly urbanized cities is compiled for monitoring economic performance at the local level. The City of Iligan started its PPA compilation since 2021.
Figure 14. Per Capita GDP of the Economies in Region X
Growth Rate (in Percent), 2021 to 2022
At Constant 2018 Prices
Full statistical tables and visuals can be accessed via the PSA website at https://psa.gov.ph/statistics/ppa and the PSA Lanao del Norte Facebook Page at https://www.facebook.com/psaLDN.
(SGD)OSLER M. MEJARES
Chief Statistical Specialist
| Attachment | Size |
|---|---|
|
|
1.14 MB |
|
|
25.36 KB |
|
|
27.87 KB |