

Release Date :
Reference Number :
CPIBuk13-2024-06
TABLE A. Year-on-Year Inflation Rates,
All Items In Percent
(2018=100)
| Area | May 2023 | April 2024 | May 2024 | Year-to-date* |
|---|---|---|---|---|
Philippines Headline | 6.1 | 3.8 | 3.9 | 3.5 |
Northern Mindanao Headline | 6.0 | 4.5 | 4.7 | 3.9 |
Bukidnon Headline | 6.8 | 5.5 | 6.0 | 5.4 |
Source: Retail Price Survey of Commodities for the Generation of Consumer Price Index Philippine Statistics Authority
Source: Retail Price Survey of Commodities for the Generation of Consumer Price Index Philippine Statistics Authority
A. Bukidnon
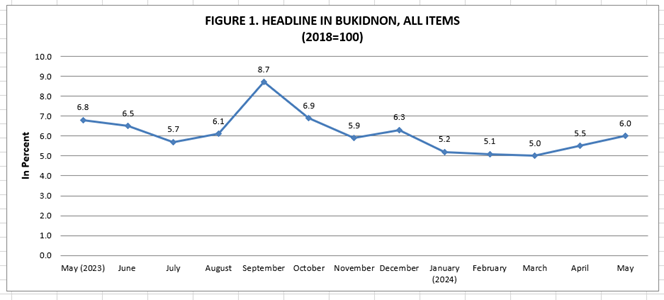
1. Headline Inflation
The headline inflation in the province increased to 6.0 percent in May 2024 from 5.5 percent in April 2024. This brings the provincial average inflation from January to May 2024 to 5.4 percent. In May 2023, inflation rate was higher at 6.8 percent.
1.1 Main Drivers to the Upward Trend of the Headline Inflation
The uptrend in the inflation in May 2024 was primarily influenced by the higher year-on-year increase in the index of the food and non-alcoholic beverages at 11.4 percent during the month from 9.4 percent in April 2024. Another contributor to the trend is the faster annual growth of the transport index at 11.2 percent from 10.8. The increase of the commodity group health at 8.3 percent in May 2024 from 7.5 percent in April 2024 and clothing and footwear at 6.4 percent from 6.2 percent also contributed to the uptrend in the inflation.
In contrast, the following commodity groups registered lower inflation rates during the month:
- Alcoholic beverages and tobacco, 3.8 percent from 4.1 percent;
- Housing, water, electricity, gas and other fuels at -7.8 percent from -5.6 percent;
- Recreation, sport and culture, 8.6 percent from 9.2 percent; and
- Personal care, and miscellaneous goods and services, 2.6 percent from 2.9 percent.
The indices of the following commodity groups retained their respective previous month’s annual rates.
- Furnishings, household equipment and routine household maintenance, 10.8 percent;
- Information and Communication, 0.2 percent;
- Education Services, 17.9 percent;
- Restaurants and accommodation services, 0.8 percent and
- Financial Services, 0.0 percent.
1.2 Main Contributors to the Headline Inflation
The top three commodity groups contributing to the May 2024 inflation were the following:
- Food and non-alcoholic beverages with 81.4 percent share or 4.89 percentage points;
- Transport with 17.7 percent share or 1.06 percentage points and
Furnishing, household equipment and routine household maintenance with 5.7 percent share or 0.34 percentage points.
2. Food Inflation
Food inflation at the provincial level increase to 12.0 percent in May 2024 from 9.7 percent in April 2024. In May 2023, food inflation was lower at 7.4 percent.
2.1 Main Drivers to the Upward Trend of Food Inflation
The acceleration of food inflation in May 2024 was mainly brought about by the higher year-on-year increase in cereals and cereal products index at 24.4 percent in May 2024 from 22.4 percent in the previous month. This was followed by meat and other parts of slaughtered land animals at -0.5 percent during the month from -7.2 percent in April 2024. Vegetables, tubers, plantains, cooking bananas and pulse also contributed to the uptrend with 5.2 percent inflation rate in May 2024 from -3.9 percent in April 2024.
Moreover, higher annual rate was noted in the index fruits and nuts, 29.1 percent from 23.0 percent.
2.2 Main Contributors to the Food Inflation
Food inflation shared 80.6 percent or 4.8 percentage points to the overall inflation in May 2024. The top three food groups in terms of contribution to the food inflation during the month were the following:
- Cereals and cereal products, which includes rice, corn, flour, bread and other bakery products, pasta products, and other cereals, with a share of 83.6 percent or 10.0 percentage points;
- Fruits and nuts with a share of 8.6 percent or 1.0 percentage point; and
- Milk, other dairy products and eggs with a share of 4.2 percent or 0.5 percentage point.
Table B. Year-on-Year Inflation Rates in Bukidnon, All Items in Percent
January 2019 – May 2024
(2018=100)
| Month | Year | |||||
|---|---|---|---|---|---|---|
| 2019 | 2020 | 2021 | 2022 | 2023 | 2024 | |
| January | 7.0 | 1.0 | 2.1 | 4.5 | 8.3 | 5.2 |
| February | 5.9 | 1.2 | 3.0 | 4.1 | 8.5 | 5.1 |
| March | 5.7 | 1.0 | 3.5 | 4.4 | 8.5 | 5.0 |
| April | 5.7 | 1.0 | 3.7 | 5.0 | 7.3 | 5.5 |
| May | 5.3 | 0.9 | 3.8 | 5.2 | 6.8 | 6.0 |
| June | 4.6 | 1.8 | 3.2 | 5.4 | 6.5 | |
| July | 2.7 | 2.7 | 2.6 | 6.0 | 5.7 | |
| August | 1.4 | 2.9 | 2.7 | 6.5 | 6.1 | |
| September | 0.3 | 2.5 | 3.5 | 6.6 | 8.7 | |
| October | -0.4 | 2.4 | 3.8 | 7.0 | 6.9 | |
| November | 0.8 | 1.5 | 4.4 | 7.0 | 5.9 | |
| December | 1.1 | 1.8 | 4.1 | 7.3 | 6.3 | |
| Average | 3.2 | 1.7 | 3.4 | 5.8 | 7.1 | 5.4 |
Source: Retail Price Survey of Commodities for the Generation of Consumer Price Index Philippine Statistics Authority
Note:
CPIs and inflation rates by province and selected city are posted at PSA website (https://openstat.psa.gov.ph/).
(SGD.)MARIA EVANGELINE N. NON
Chief Statistical Specialist
| Attachment | Size |
|---|---|
|
|
802.82 KB |