

Table A. Year-on-Year Headline Inflation Rates, All Items in Percent:
September 2023, and August to September 2024 (2018=100)
| Area | Aug 2023 | Jul 2024 | Aug 2024 | Year- to-date* |
| Philippines | 6.1 | 3.3 | 1.9 | 3.4 |
| Region X | 6.7 | 4.2 | 1.6 | 4.0 |
| Misamis Oriental | 7.3 | 5.8 | 2.5 | 4.5 |
Source: Philippine Statistics Authority, Retail Price Survey of Commodities for the Generation of Consumer Price Index
*Year-on-year change of CPI for January to September, 2024 vs 2023
Headline Inflation
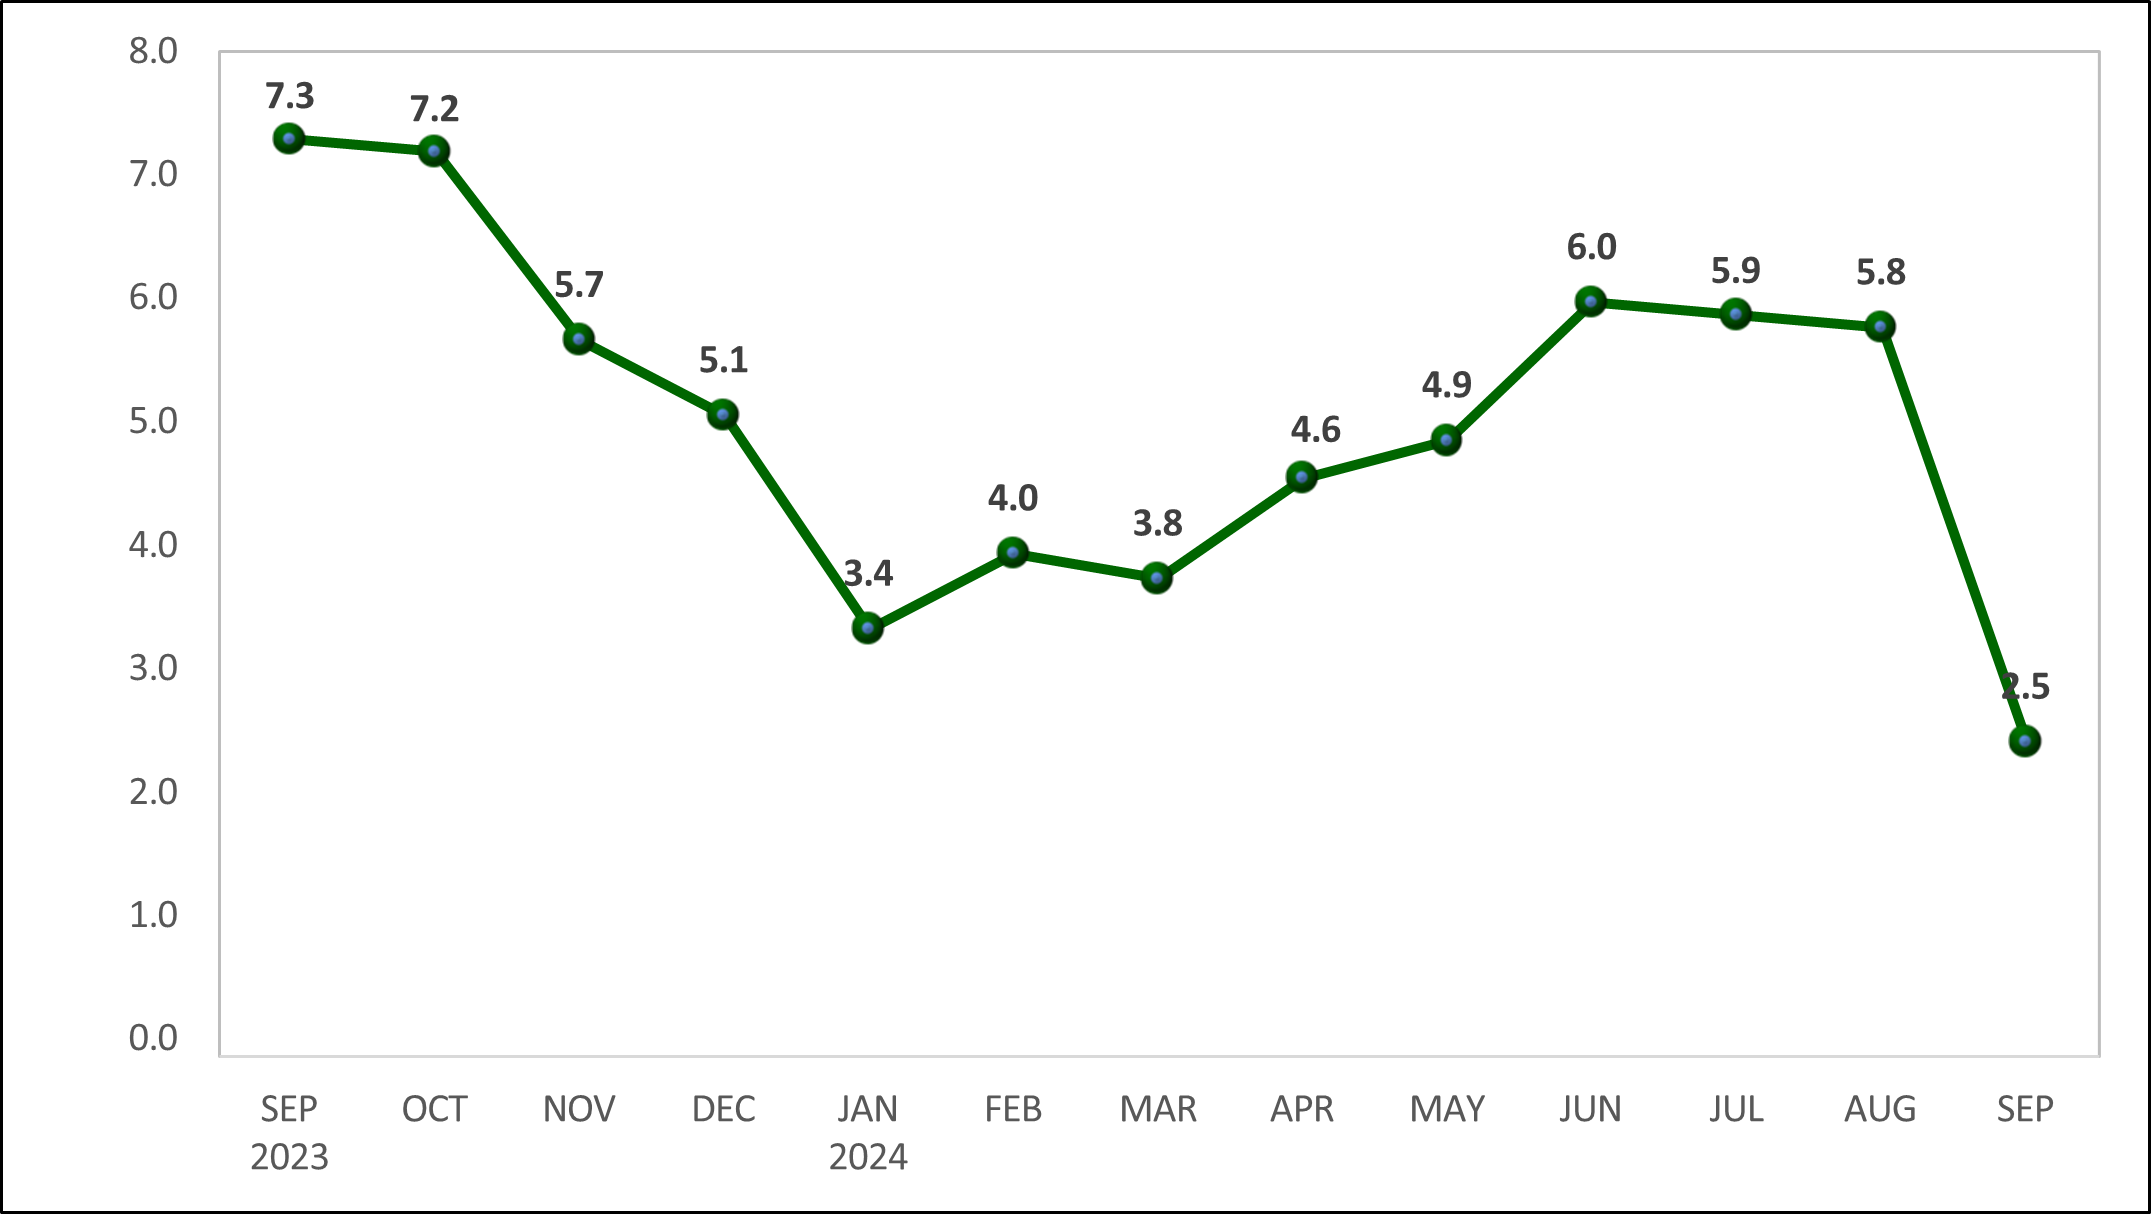
The headline inflation or overall inflation of Misamis Oriental recorded at 2.5 percent in September 2024, a decline of 3.3 percentage points from the 5.8 percent inflation in August 2024. This brought about the January to September 2024 provincial average inflation rate to 4.5 percent. During the month, the provincial inflation rate was higher than the national and regional inflation rates by 0.6 percentage points and 0.9 percentage point, respectively. (Table A)
The provincial inflation from June to September 2024 presented a decreasing trend. Furthermore, the province’s inflation in September 2024 hit the bottom of the trend since September 2023. (Figure 1)
3rd Floor, Limketkai Module-2 BPO & Cyberpark Bldg., Rosario Crescent Limketkai Center, Brgy 31, Cagayan de Oro City
Contact Number: 09565766106 Email: misamisoriental@psa.gov.ph
Figure 1. Headline Inflation Rates in Misamis Oriental, All Items in Percent: September 2023 to September 2024
(2018=100)
Source: Philippine Statistics Authority, Retail Price Survey of Commodities for the Generation of Consumer Price Index
Main Drivers to the Downward Trend of the Headline Inflation
The province’s downward trend was mainly driven by the slower inflation in food and non-alcoholic beverages at 1.9 percent in September 2024 from 8.3 percent in August 2024. Transport came next with -1.1 percent from 1.9 percent. Housing, water, electricity, gas and other fuels followed with 4.7 percent from 5.1 percent. Next was clothing and footwear at 1.6 percent from 1.7 percent. Lastly, alcoholic beverages and tobacco at 10.9 percent from 11.0 percent.
In contrast, three commodity groups posted faster inflation rates during the month than the preceding month: furnishings, household equipment and routine household maintenance at 3.6 percent from 3.4 percent; recreation, sport and culture at 8.2 percent from 7.6 percent; and personal care, and miscellaneous goods and services at 4.4 percent from 4.2 percent.
Furthermore, five commodity groups retained their inflation rates in the previous month: health at 4.6 percent; information and communication at -1.6 percent; education services at 0.0 percent; restaurants and accommodation services at 1.2 percent; and financial services at -0.1 percent. (Table B)
Main Contributors to the Headline Inflation
The top three commodity groups contributing to the overall inflation during the month were the following:
- Housing, water, electricity, gas and other fuels with 37.8 percent share or 0.95 percentage points;
- Food and non-alcoholic beverages with 7 percent share or 0.82 percentage points; and
- Alcoholic beverages and tobacco with 8 percent share or 0.30 percentage points.
The rest of the commodity groups accounted for 17.7 percent share or 0.44 percentage points.
Table B. Inflation Rates by Commodity Group in Misamis Oriental, in Percent: September 2023, and August to September 2024
(2018 = 100)
| Commodity Group | Sep 2023 | Aug 2024 | Sep 2024 |
| All Items | 7.3 | 5.8 | 2.5 |
| Food and Non-Alcoholic Beverages | 14.3 | 8.3 | 1.9 |
| Alcoholic Beverages and Tobacco | 2.5 | 11.0 | 10.9 |
| Clothing and Footwear | 4.8 | 1.7 | 1.6 |
| Housing, Water, Electricity, Gas and Other Fuels | 2.2 | 5.1 | 4.7 |
| Furnishings, Household Equipment and Routine Household Maintenance | 2.6 | 3.4 | 3.6 |
| Health | 0.9 | 4.6 | 4.6 |
| Transport | -2.0 | 1.9 | -1.1 |
| Information and Communication | 0.3 | -1.6 | -1.6 |
| Recreation, Sport and Culture | 0.7 | 7.6 | 8.2 |
| Education Services | 0.1 | 0.0 | 0.0 |
| Restaurants and Accommodation Services | 5.4 | 1.2 | 1.2 |
| Financial Services | 0.0 | -0.1 | -0.1 |
| Personal Care, and Miscellaneous Goods and Services | 5.5 | 4.2 | 4.4 |
Source: Philippine Statistics Authority, Retail Price Survey of Commodities for the Generation of Consumer Price Index
Food Inflation
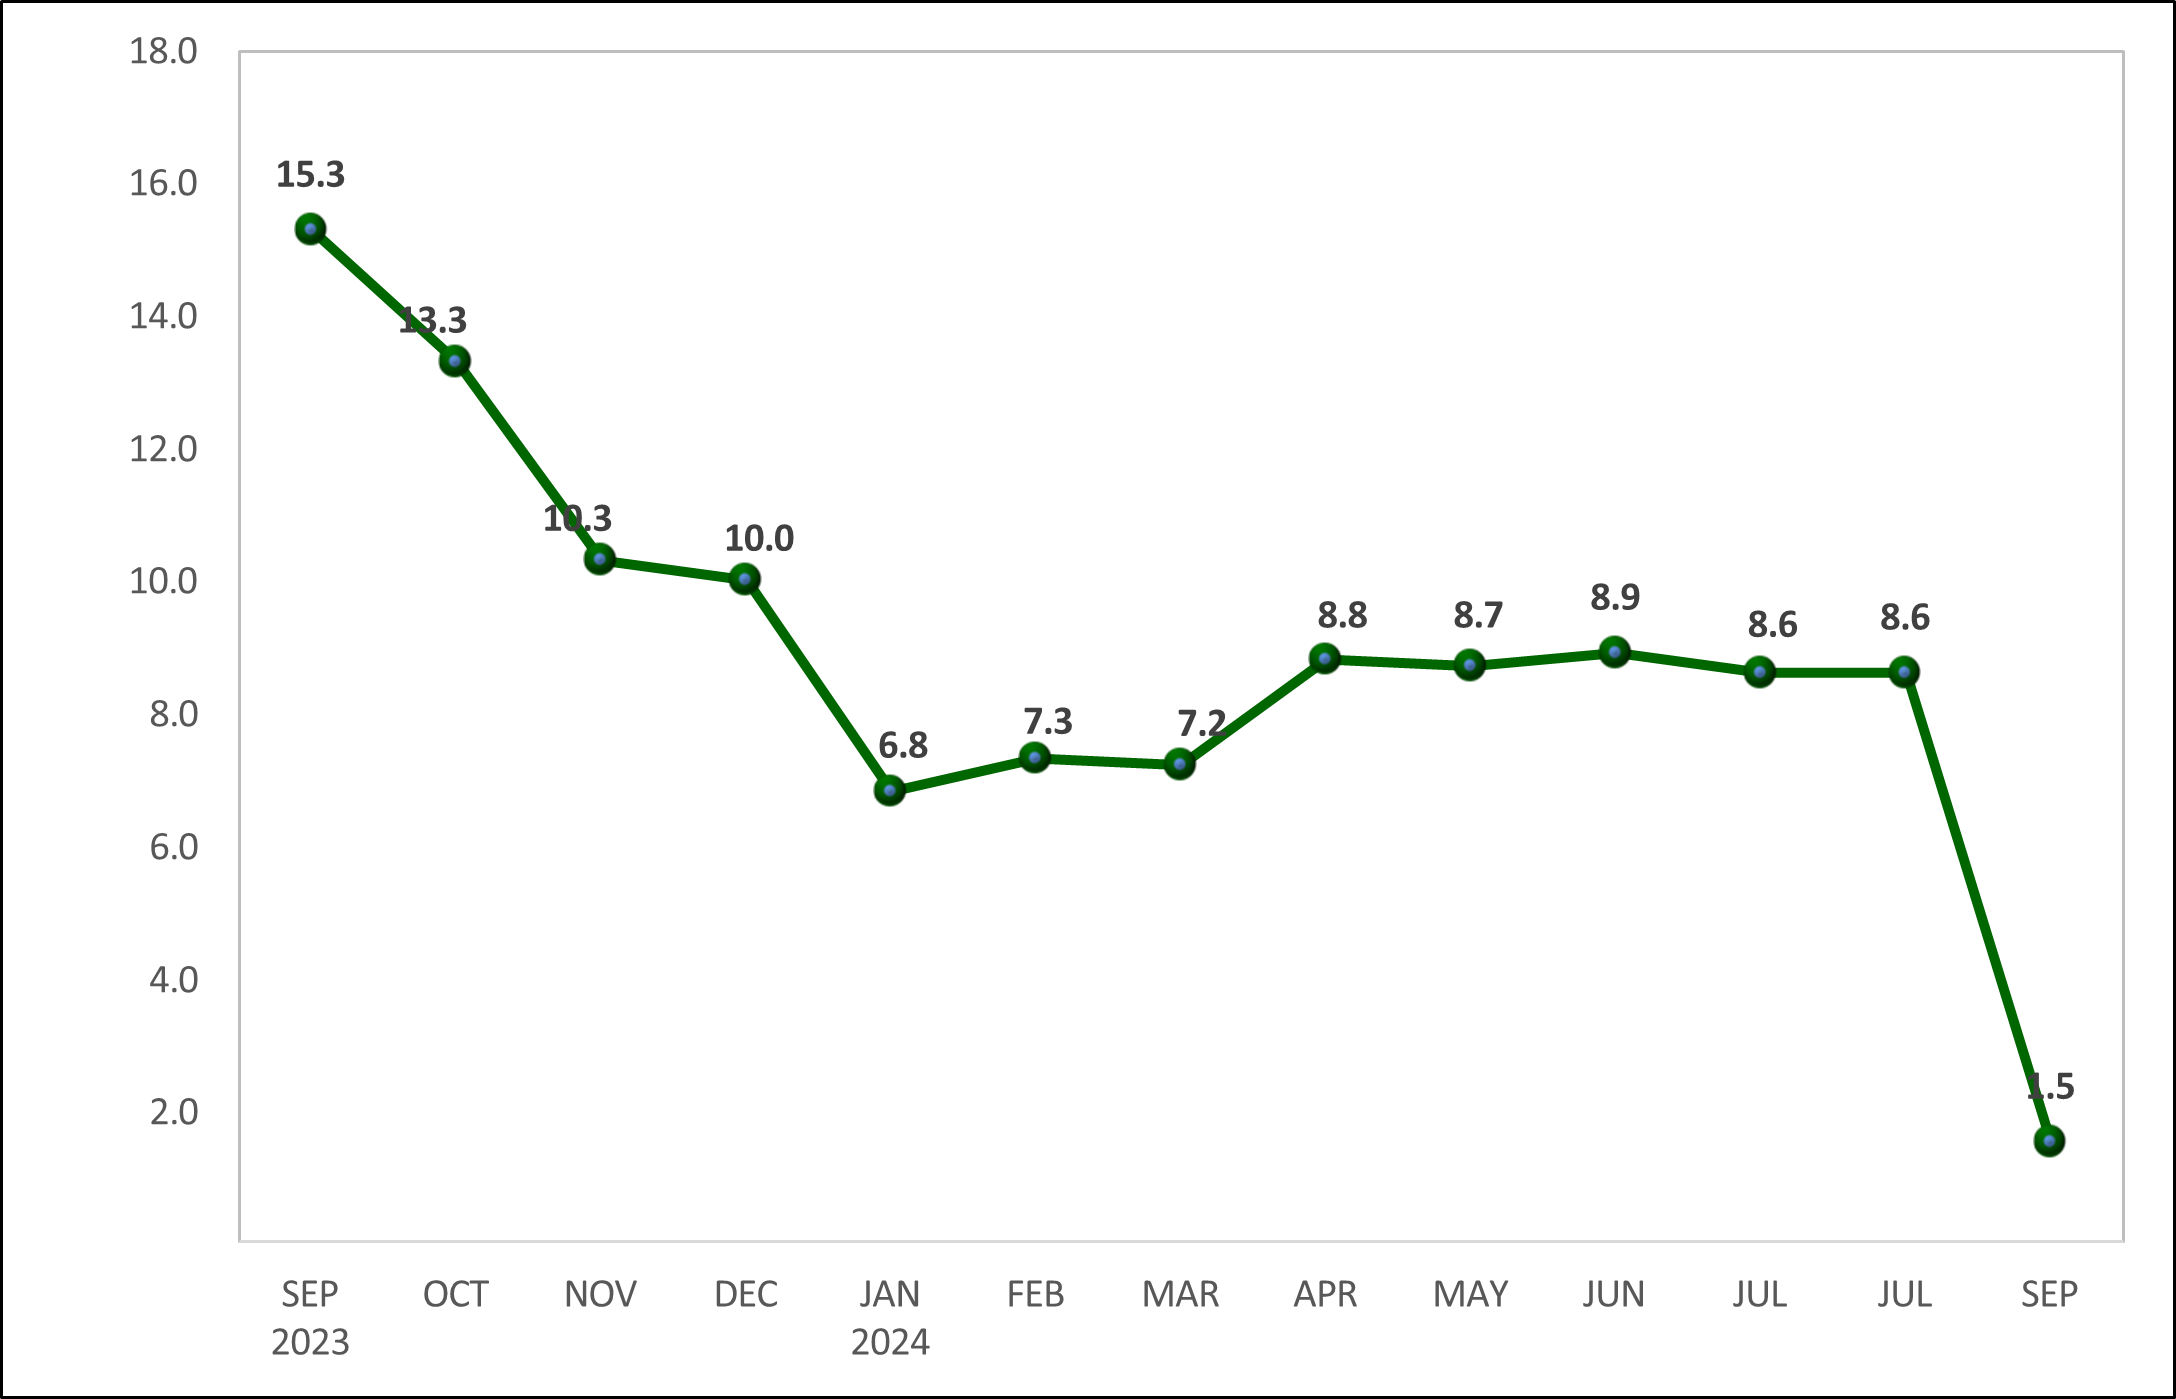
In September 2024, the provincial food inflation rate registered 1.5 percent. It decelerated by 6.8 percentage points from 8.3 percent in August 2024. Moreover, the province’s food inflation during the month was the slowest since September 2023. (Figure 2)
As shown in Table C, the Consumer Price Index (CPI) of food in the province recorded at 139.1 in September 2024, which was lower than the CPI in August 2024 at 140.3. However, it was higher than the CPI I September 2023 at 137.1. On average, prices have increased by 39.1 percent since the base year of 2018, when the CPI was at 100. The base year serves as a reference point for comparison to see how much prices have changed over time.
Figure 2. Food Inflation Rates in Misamis Oriental, in Percent:
September 2023 to September 2024
(2018=100)
Source: Philippine Statistics Authority, Retail Price Survey of Commodities for the Generation of Consumer Price Index
Main Drivers to the Downward Trend of the Food Inflation
The primary driver of the province’s decreasing trend in September 2024 food inflation was cereals and cereal products at -0.2 percent during the month from 17.1 percent in August 2024. This was followed by vegetables, tubers, plantains, cooking bananas and pulses at -12.2 percent from 2.5 percent. Meat and other parts of slaughtered land animals came next at 1.7 percent from 3.2 percent. The following food groups also posted slower inflation rates during the month than the prior month: sugar, confectionery and desserts at -5.2 percent from -4.5 percent; and oils and fats at -3.7 percent from -3.6 percent.
On the other hand, four food groups recorded faster inflation rates during the month compared to the previous month: fish and other seafood at 2.8 percent from 2.4 percent; milk, other dairy products and eggs at 8.0 percent from 6.2 percent; fruits and nuts at 26.2 percent from 18.6 percent; and ready-made food and other food products n.e.c. at 7.6 percent from 7.0 percent. (Table C)
Main Contributors to the Food Inflation
Food inflation shared 22.4 percent, or 0.56 percentage points, of the overall inflation during the month. The top three food groups in terms of contribution to the food inflation during the month were the following:
- Fruits and nuts with 6 percent share or 0.88 percentage points;
- Milk, other dairy products and eggs with 7 percent share or 0.75 percentage points; and
- Fish and other seafood with 28.6 percent share or 0.43 percentage
The remaining food groups shared -37.0 percent or contributed -0.55 percentage points to the total food inflation.
Table C. Consumer Price Index, and Year-on-Year Percent Changes by Food Group in Misamis Oriental
(2018 = 100)
| Commodity Group | Consumer Price Index (CPI) | Inflation Rates (in %) | |||
Sep 2023 | Aug 2024 | Sep 2024 | Aug 2024 | Sep 2024 | |
| Food | 137.1 | 140.3 | 139.1 | 8.3 | 1.5 |
| Cereals and Cereal Products | 120.6 | 120.5 | 120.4 | 17.1 | -0.2 |
| Cereals | 119.9 | 119.8 | 119.6 | 20.9 | -0.3 |
| Rice | 115.2 | 114.6 | 114.6 | 22.3 | -0.5 |
| Corn | 148.9 | 151.2 | 150.4 | 14.7 | 1.0 |
| Flour, Bread and Other Bakery Products, Pasta Products, and Other Cereals | 124.4 | 124.5 | 124.7 | 0.1 | 0.3 |
| Meat And Other Parts of Slaughtered Land Animals | 157.2 | 159.8 | 159.9 | 3.2 | 1.7 |
| Fish And Other Seafood | 155.1 | 160.2 | 159.4 | 2.4 | 2.8 |
| Milk, Other Dairy Products and Eggs | 117.0 | 124.5 | 126.4 | 6.2 | 8.0 |
| Oils And Fats | 123.5 | 119.0 | 118.9 | -3.6 | -3.7 |
| Fruits And Nuts | 162.9 | 194.2 | 205.5 | 18.6 | 26.2 |
| Vegetables, Tubers, Plantains, Cooking Bananas and Pulses | 163.0 | 165.3 | 143.1 | 2.5 | -12.2 |
| Sugar, Confectionery and Desserts | 154.2 | 146.1 | 146.2 | -4.5 | -5.2 |
| Ready-Made Food and Other Food Products N.E.C. | 132.0 | 141.3 | 142.0 | 7.0 | 7.6 |
Source: Philippine Statistics Authority, Retail Price Survey of Commodities for the Generation of Consumer Price Index
Note: CPIs and inflation rates by province and selected city are posted at the PSA OpenSTAT portal accessible at https://www.psa.gov.ph
(SGD.) MARIA LIZA M. BIGORNIA
(Chief Statistical Specialist)
Officer-In-Charge