

September's Inflation Rate Decreases Significantly by 1.3% in October – A Mark of Economic Stability Unveiled
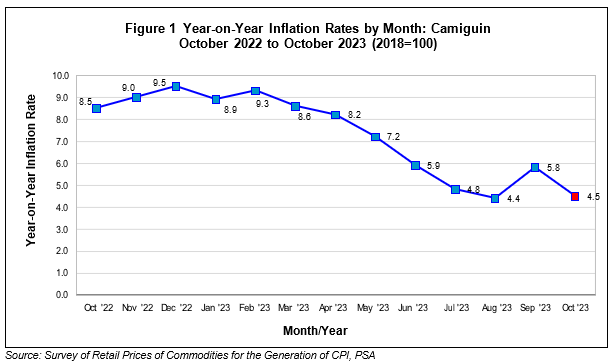
In October 2023, Camiguin's inflation rate continued its downward trend, reaching 4.5 percent—a significant drop of 1.3 percentage points from the previous month's 5.8 percent. This decline marked a notable deceleration in price increases. Throughout the year 2023, the province experienced an average inflation rate of 6.8 percent, indicating a overall moderation in the region's economic landscape.
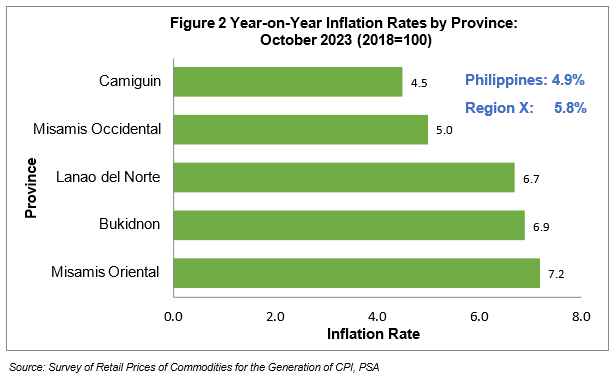
Furthermore, a trend of decreasing inflation rates swept across all provinces in the Northern Mindanao region. Misamis Oriental, with the highest inflation rate in the region, saw a slight decrease from 7.3 percent to 7.2 percent, marking a modest improvement. Meanwhile, Bukidnon experienced a significant drop, reducing its inflation rate from 8.7 percent in September 2023 to 6.9 percent in October 2023, reflecting a substantial 1.8 percentage point decrease. Similarly, Misamis Occidental and Lanao del Norte witnessed declines in their inflation rates, reaching 5.0 percent and 6.7 percent, respectively. These figures underscore a positive trend in the economic landscape of Northern Mindanao, indicating improved stability and control over price levels. (See Figure 2)
The province experienced a sustained decrease in overall inflation during October 2023, driven significantly by the reduction in year-on-year rates within key sectors. Specifically, the food, non-alcoholic beverages, alcoholic beverages, and tobacco index demonstrated a notable decline, dropping from 11.5 percent in September to 8.7 percent in October—a substantial decrease of approximately 2.8 percentage points. Moreover, several other commodity groups displayed lower annual increments in October 2023, contributing to the overall downward trend in inflation. This data underscores a positive economic trajectory for the province, marked by controlled price levels and increased financial stability.
• Transport, -6.7 percent from -5.4 percent;
• Restaurants and Accommodation Services 3.7 percent from 3.4 percent.
In contrast, the Housing, Water, Electricity, Gas, and Other Fuels sector maintained a stable inflation rate, remaining unchanged at 3.7 percent from September 2023 to October 2023. Similarly, the Recreation, Sport, and Culture sector sustained its inflation rate at 2.9 percent during this period. Additionally, the indices of financial and education services showed no change, recording a flat, zero percent annual inflation rate in October 2023. These consistent figures reflect a balanced and steady economic environment in these specific sectors, contributing to the overall stability of the province's economy. (See Table 1)
Table 1 Year-on-Year Inflation Rates by Commodity Group:
Camiguin (2018 = 100)
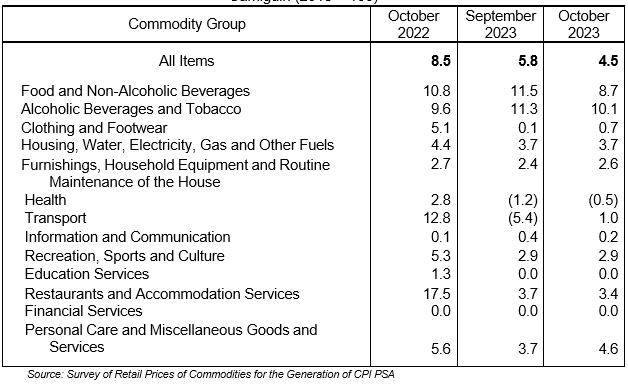
Despite the overall decrease in inflation rate in the province of Camiguin, a notable uptick was observed in the year-on-year increase of the Furnishings, Household Equipment, and Routine Household Maintenance index, rising from 2.4 percent in September 2023 to 2.6 percent. Additionally, there was a slight increase in the inflation rates of Personal Care, and Miscellaneous Goods and Services, climbing by approximately 0.9 percentage points. The acceleration in Household and Personal Care Services inflation was predominantly driven by the higher year-on-year growth rate observed in Household Maintenance services.
On the other hand, several indices experienced lower annual growth rates in October 2023 compared to their previous month's inflation figures.
• Cereals and Cereal Products, 13.8 percent;
• Milk, other dairy products, and eggs, 24.4 percent;
• Oils and fats, 4.8 percent;
• Vegetables, tubers, plantains, cooking bananas, and pulses, 4 percent; and
• Sugar, confectionery and desserts, -0.9 percent.
(SGD)FRANCISCO C. GALAGAR JR.
Chief Statistical Specialist
Technical Notes
This Special Release presents the results of the Survey of Retail Prices of Commodities and Services for the Generation of Consumer Price Index (CPI) conducted in August 2023.
CPI
The CPI is an indicator of the change in the average retail prices of a fixed basket of goods and services commonly purchased by households for their day-to-day consumption relative to a base year.
Uses of the CPI
As an indicator, the CPI is most widely used in the calculation of the inflation rate and purchasing power of the peso. It is a major statistical series used for economic analysis and as monitoring indicator of government economic policy.
The CPI is also used as a deflator to express value series in real terms, which is, measuring the change in actual volume of transactions by removing the effects of price changes. Another major importance of the CPI is its use as basis to adjust wages in labor management contracts as well as pensions and retirement benefits. The CPI also serves as inputs in wage adjustments through the collective bargaining agreements.
Components of the CPI
a. Base Period This is a reference date or simply a convenient benchmark to which a continuous series of index numbers can be related. Since the CPI measures the average changes in the retail prices of a fixed basket of goods, it is necessary to compare the movement in previous years back to a reference date at which the index is taken as equal to 100.
The present series uses the 2018 as the base year. The year 2018 was chosen as the base year because it is the year when the Family Income and Expenditure Survey (FIES) was conducted. The FIES is the basis of the CPI weights.
b. Market Basket
Market basket refers to a sample of thousands of varieties of goods purchased for consumption and services availed by the households in the country. It was selected to represent the composite price behavior of all goods and services purchased by the consumers.
c. Weighting System
The weighting system is a desirable system that considers the relevance of the components of the index. For the CPI, the weighting pattern uses the expenditures on various consumer items purchased by households as a proportion to total expenditures.
d. Geographic Coverage CPI values are computed at the national, regional, and provincial levels, and for selected cities. A separate CPI for NCR is also computed.
e. Classification Standards The 2012-based CPI series is the first in the series that used the 1999 United Nations Classification of the Individual Consumption According to Purpose (COICOP) in determining the commodity groupings of the items and services included in the market basket. The 2018-based CPI also follows the 2015 Philippine Standard Geographic Classification codes.
Inflation Rate
The inflation rate (IR) is the annual or monthly rate of change of the CPI in percent. It is interpreted in terms of declining purchasing power of money.