

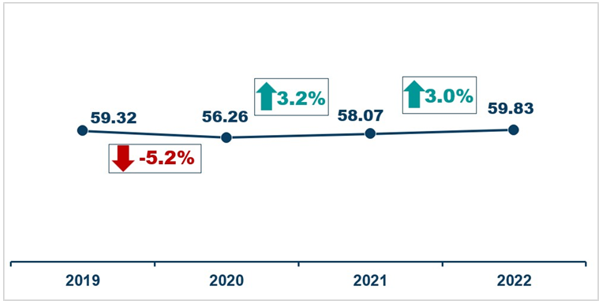
The Gross Domestic Product (GDP) of Lanao del Norte grew by 3.0 percent in 2022 which translates to a value of PhP 59.83 billion. The economic expansion was slower than the 3.2 percent growth registered in the previous year. Despite the decelerated growth, the province was able to reach a GDP level that exceeds the 2019 pre-pandemic level of PhP 59.32 billion. This is an indication that the province had recovered from the negative effects of the pandemic. (Figure 1)
Figure 1. Gross Domestic Product of Lanao del Norte: 2019 to 2022
Levels (in Billion PhP) and Growth Rates (in Percent)
at Constant 2018 Prices
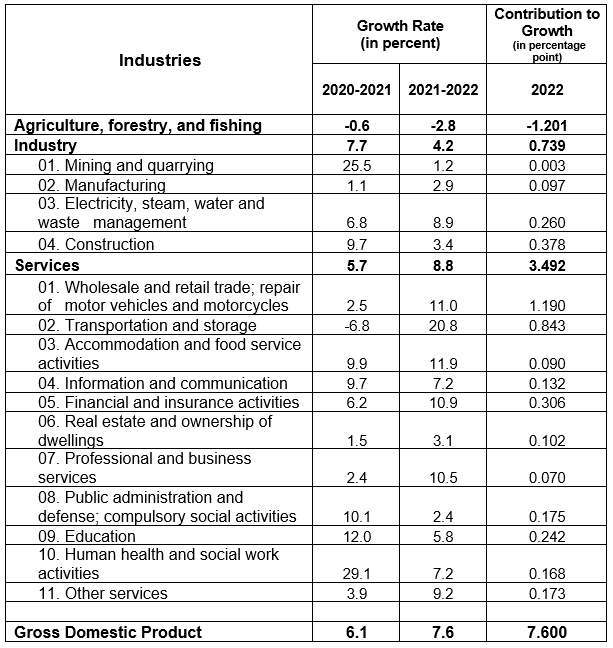
Among the major industries, Services and Industry went up by 8.8 percent and 4.2 percent, respectively. Meanwhile, Agriculture, forestry and fishing contracted by 2.8 percent. (Table 1)
The largest contributors to the 3.0 economic growth were Wholesale and retail trade; repair of motor vehicles and motorcycles, followed by Transportation and storage, Construction, Financial and Insurance Services, and Electricity, steam, water and waste management. (Table 1)
On the other hand, the 5 fastest growing industries were Transportation and storage with 20.8 percent, Accommodation and food service activities with a gain of 11.9 percent, Wholesale and retail trade; repair of motor vehicles and motorcycles, with 11.0 percent, Financial and insurance activities which expanded by 10.9 percent, and Professional and business services which increased by 10.5 percent. (Table 1)
Table 1. Gross Domestic Product of Lanao del Norte, by Industry
Growth Rate (in Percent), Contribution to Growth (in percentage point)
At Constant 2018 Prices, 2020 to 2022
Structure of the Economy
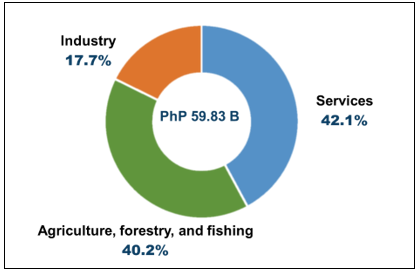
The economy of the province is predominantly Services-based. Services shared 42.1 percent of the total economy of the province, followed by Agriculture, Forestry, and Fishing accounting for 40.2 percent, and Industry sharing 17.7 percent. (Figure 2)
Figure 2. Share of Major Industries to the Economy
of Lanao del Norte: 2022
In Percent, At Constant 2018 Prices
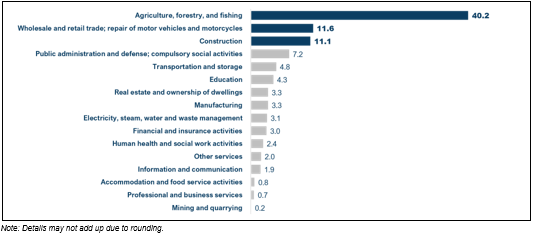
The three largest industries in the province were Agriculture, forestry, and fishing, Wholesale and retail trade; repair of motor vehicles and motorcycles, and Construction. These 3 largest industries accounted for 62.9 percent of the province’s economy. (Figure 3)
Figure 3. Share of Industries to the Economy of Lanao del Norte: 2022
In Percent, At Constant 2018 Prices
Per Capita GDP
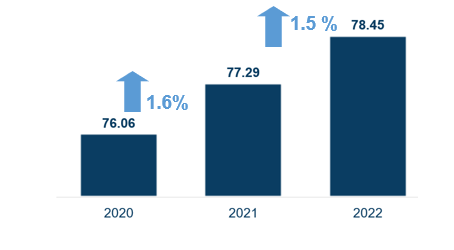
The GDP value contributed by each individual in the province is described by the per capita GDP. The per capita GDP of Lanao del Norte increased by 1.5 percent, slower than the recorded increase in per capita GDP of 1.6 percent in the previous year. The capita GDP of the province recorded a value of PhP 78.45 thousand. (Figure 4)
Figure 4. Per Capita GDP of Lanao del Norte: 2020-2022
Level (in thousand PhP), Growth Rate (in percent)
At Constant 2018 Prices
Lanao del Norte vis-à-vis Other Economies in Northern Mindanao
The province was one of the 2 economies in the region which recorded slower growth than the regional economic growth of 7.2 percent. It also recorded as the slowest growing economy in the region. (Figure 5)
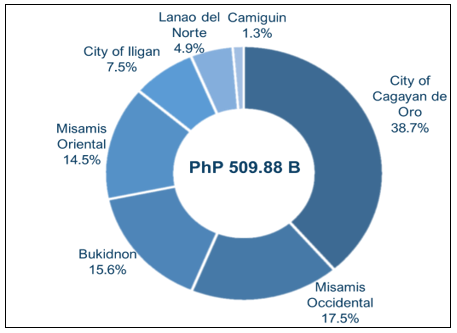
Moreover, the province accounted for the 6th largest share of 6.4 percent to the Gross Regional Product of Region X. (Figure 6)
In Agriculture, Forestry and Fishing (AFF), the province was one of the 4 economies in the region which showed contraction. (Figure 7)
In terms of share to AFF, the province had the second largest share of 12.9 percent to the total AFF of the region, next to Bukidnon with a lion’s share of 67.2 percent. (Figure 8)
Figure 5. Gross Domestic Product of Northern Mindanao, by Province/HUC
Growth Rate (in Percent), 2021 to 2022
at Constant 2018 Prices
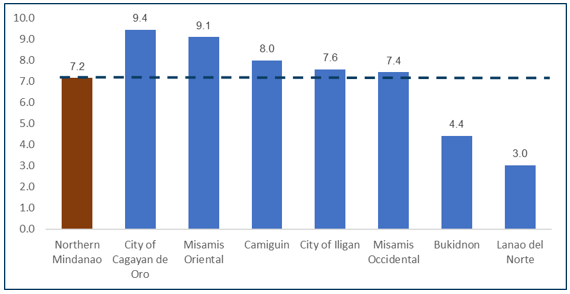
Figure 6. Share of Economies to the Gross Regional Domestic Product
of Northern Mindanao: 2022
Share (in Percent), at Constant 2018 Prices
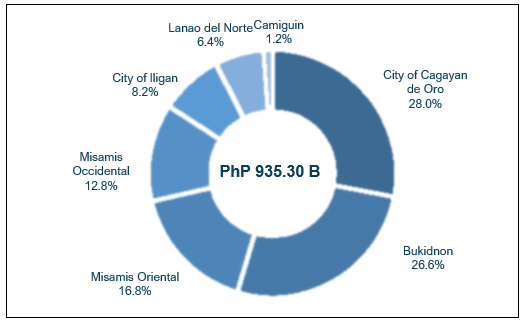
Figure 7. Gross Value Added in Agriculture, Forestry, and Fishing
of Northern Mindanao, by Province/HUC
Growth Rate (in Percent), 2021 to 2022
at Constant 2018 Prices
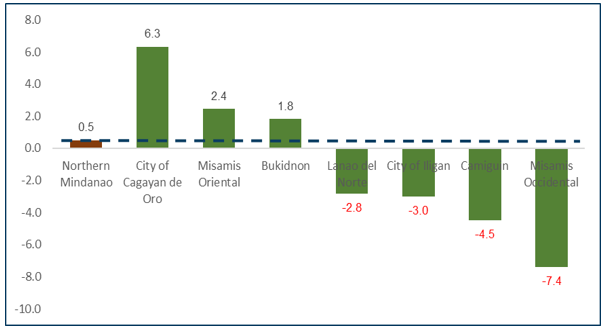
Figure 8. Share of Economies to 2022 Agriculture, Forestry, and Fishing
of Northern Mindanao: 2022
Share (in Percent), at Constant 2018 Prices
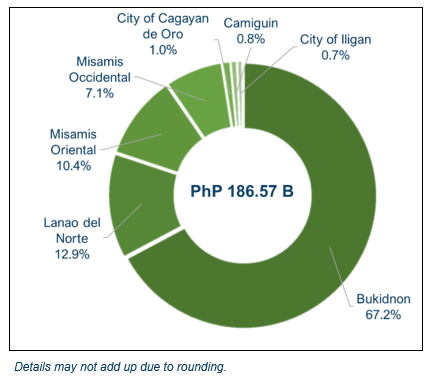
Figure 9. Gross Value Added in Industry of Northern Mindanao,
by Province/HUC
Growth Rate (in Percent), 2021 to 2022
at Constant 2018 Prices
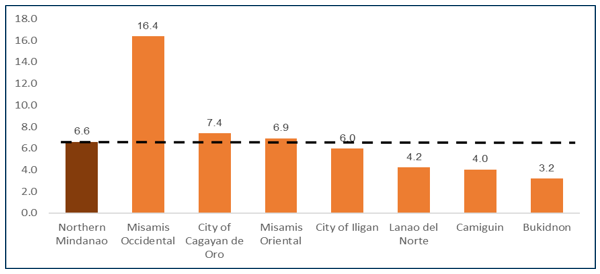
Looking at the performance of the economies in Industry, the province expanded at a slower rate as compared with the regional average growth of 6.6 percent. It posted the 5th fastest increase in Industry among the seven economies of the region. (Figure 9)
In terms of Industry share, the province had the 6th biggest industry share of 4.4 percent. (Figure 10)
Figure 10. Share of Economies to 2022 Industry of Northern Mindanao: 2022
Share (in Percent), at Constant 2018 Prices
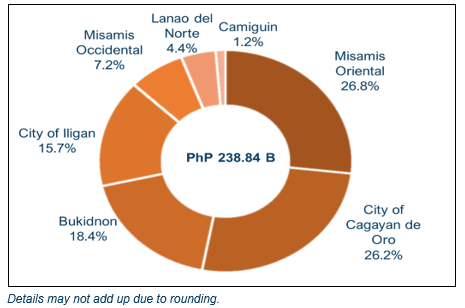
Figure 11. Gross Value Added in Services of Northern Mindanao,
by Province/HUC
Growth Rate (in Percent), 2021 to 2022
at Constant 2018 Prices
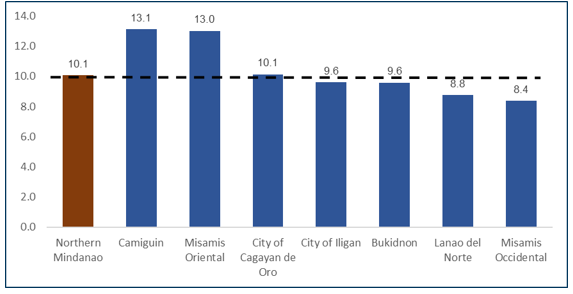
The province also posted slower growth in Services as compared to the regional average growth of 10.1 percent. It ranked 6th among the seven economies in terms of growth rate in Services. (Figure 11)
Figure 12. Share of Economies to 2022 Services of Northern Mindanao: 2022
Share (in Percent), at Constant 2018 Prices
In terms of share to Services in Region X, the province accounted for the 6th largest share of 4.9 percent. (Figure 12)
Figure 13. Per Capita GDP of the Economies in Region X: 2022
In Thousand Pesos, at Constant 2018 Prices
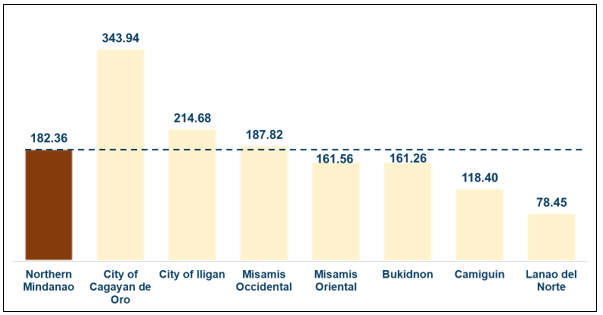
In terms of per capita GDP, the province of Lanao del Norte had the lowest level of per capita GDP of PhP 78.45 billion. Its per capita GDP was 56.9 percent lower than the than the regional per capita GDP. (Figure 13)
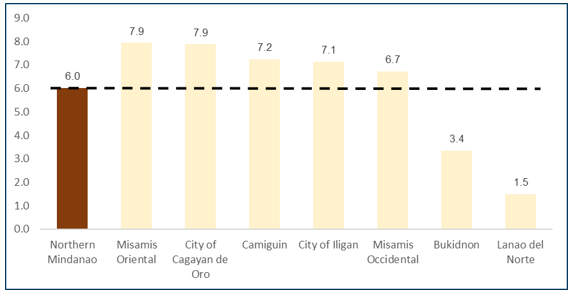
In terms of per capita GDP growth rate, the province recorded the slowest growth rate in per capita GDP among the seven economies. (Figure 14)
The Provincial Product Accounts or PPA is a mechanism of the PSA to compile the annual estimates of Gross Domestic Product by province and highly urbanized cities, consistent with the National and Regional Accounts of the Philippines. In 2023, a PPA for 82 provinces and 17 highly urbanized cities is compiled for monitoring economic performance at the local level. The province of Lanao del Norte started its PPA compilation since 2021.
Figure 14. Per Capita GDP of the Economies in Region X
Growth Rate (in Percent), 2021 to 2022
At Constant 2018 Prices
Full statistical tables and visuals can be accessed via the PSA website at https://psa.gov.ph/statistics/ppa and the PSA Lanao del Norte Facebook Page at https://www.facebook.com/psaLDN.
(SGD)OSLER M. MEJARES
Chief Statistical Specialist