

Table A. Year-on-Year Headline Inflation Rates, All Items in Percent:
February 2023, and January to February 2024
(2018=100)
| Area | Feb 2023 | Jan 2024 | Feb 2024 | Year- to-date* |
| Philippines | 8.6 | 2.8 | 3.4 | 3.1 |
| Region X | 8.0 | 3.1 | 3.4 | 3.3 |
| Misamis Oriental | 8.2 | 3.4 | 4.0 | 3.7 |
Source: Philippine Statistics Authority, Retail Price Survey of Commodities for the Generation of Consumer Price Index
*Year-on-year change of CPI for January to February, 2024 vs 2023
Headline Inflation
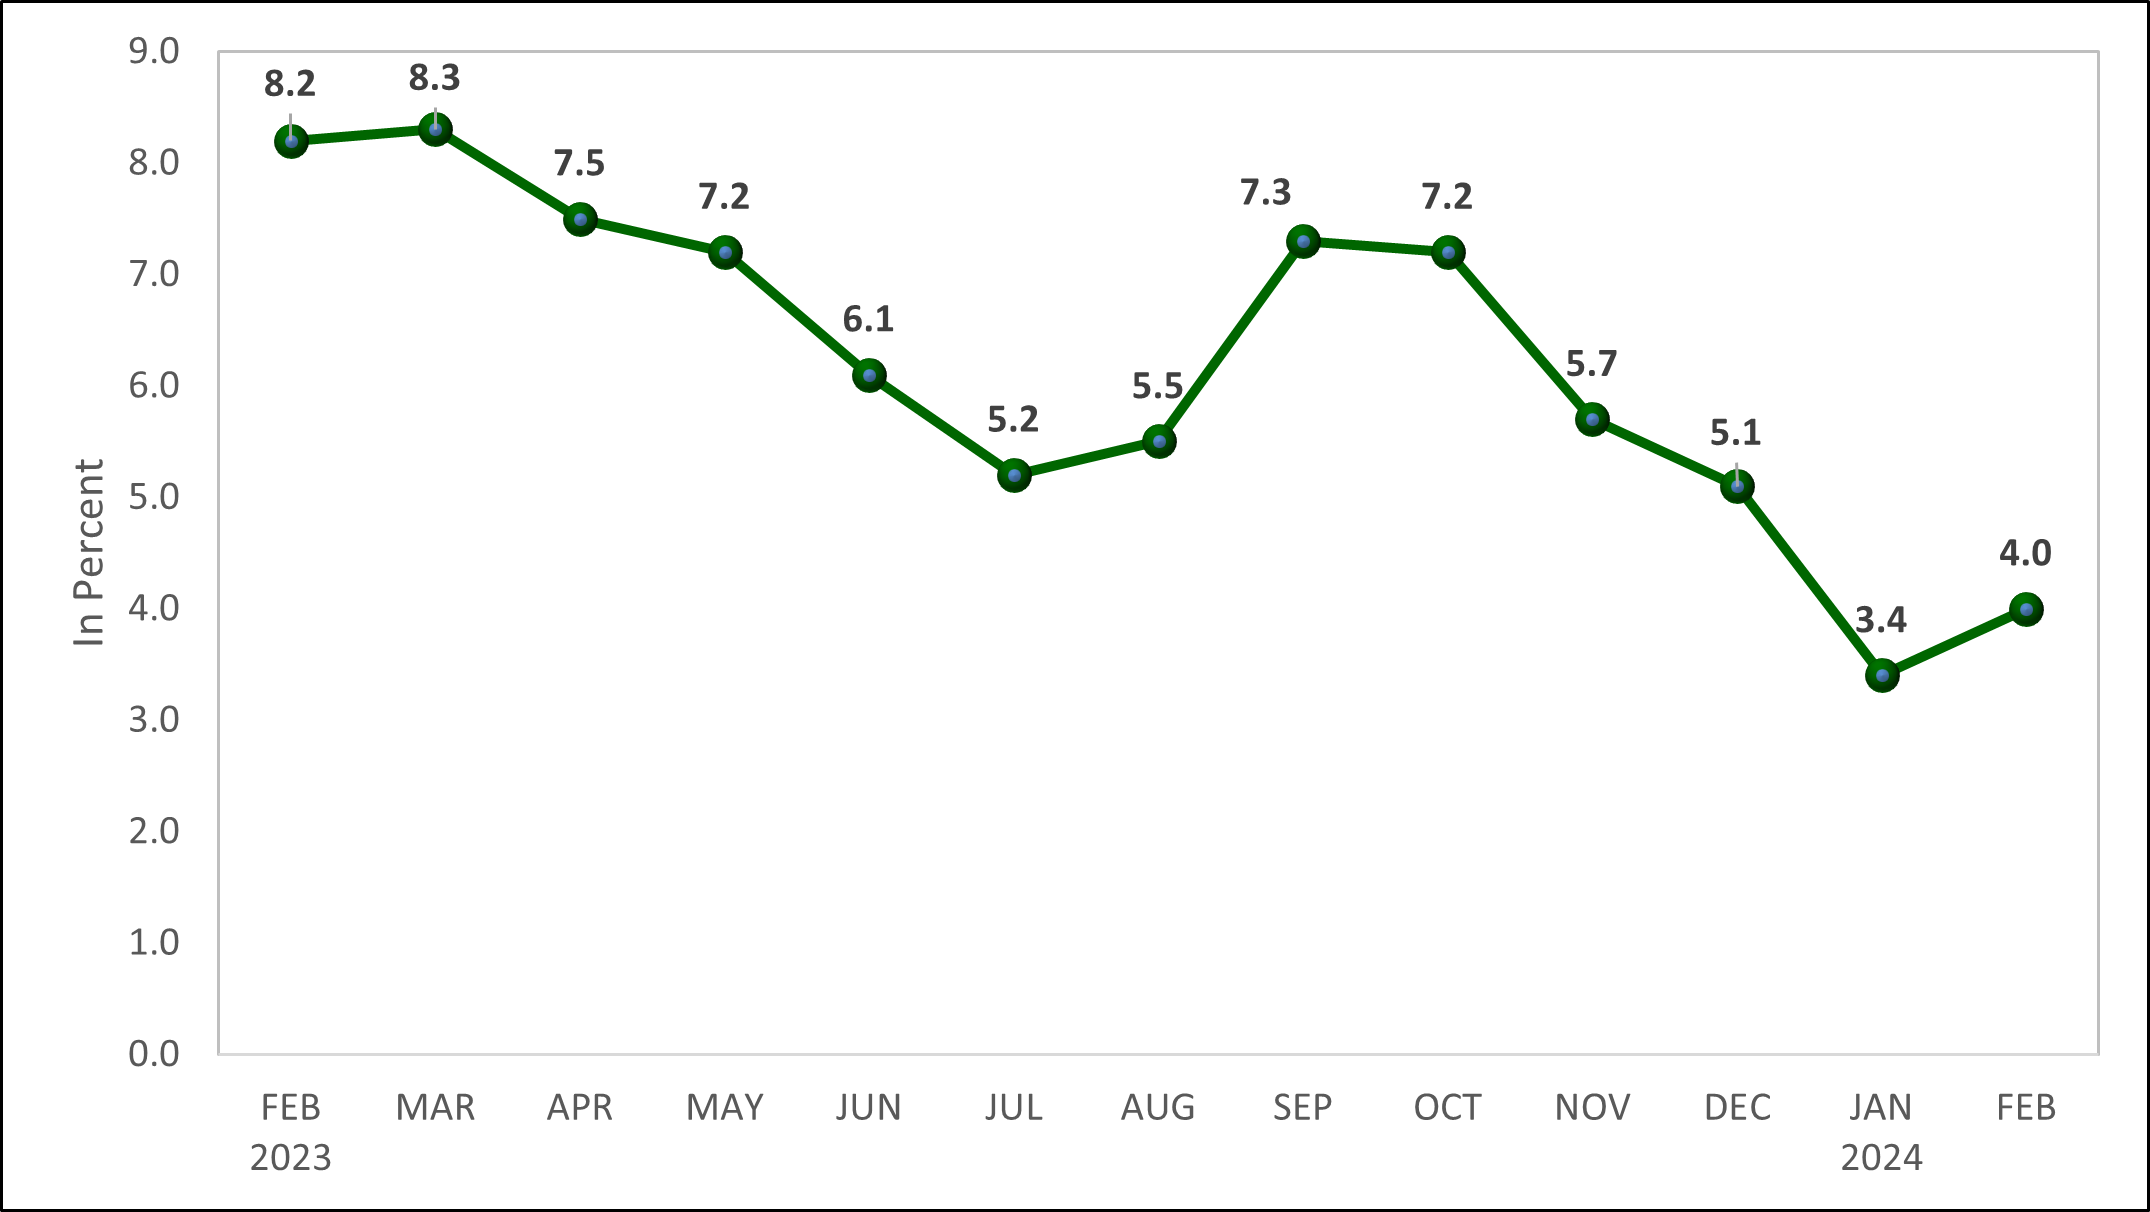
The Province of Misamis Oriental recorded a headline inflation rate of 4.0 percent in February 2024, a faster rate than the January 2024 inflation at 3.4 percent. Hence, the provincial average inflation rate from January 2024 to February 2024 was at 3.7 percent. Furthermore, the provincial inflation rate was higher than the regional and national rate which were both at 3.4 percent. (Table A)
Moreover, the inflation rate of the province in February 2024 was lower than the inflation rates from February 2023 to December 2023. It was notably slower than half of the inflation rates in February 2023 and March 2023 at 8.2 percent and 8.3 percent, respectively. (Figure 1)
Figure 1. Headline Inflation Rates in Misamis Oriental, All Items:
February 2023 to February 2024
(2018=100)
Source: Philippine Statistics Authority, Retail Price Survey of Commodities for the Generation of Consumer Price Index
Main Drivers to the Upward Trend of the Headline Inflation
The increasing trend in February 2024 inflation rate was primarily influenced by the higher inflation rate in food and non-alcoholic beverages at 7.2 percent during the month from 6.7 percent in the preceding month.
Other commodity groups that contributed to the uptrend during the month were:
- Alcoholic beverages and tobacco, 10.6 percent from 7.3 percent;
- Transport, 0.9 percent from 0.0 percent;
- Restaurants and accommodation services, 3.1 percent from 2.3 percent;
- Housing, water, electricity, gas and other fuels, -0.2 percent from -0.4 percent; and
- Furnishings, household equipment and routine household maintenance, 2.0 percent from 0.9 percent.
In contrast, four commodity groups posted lower inflation rates in February 2024:
- Clothing and footwear, 1.1 percent from 1.8 percent;
- Health, -0.1 percent from 0.1 percent;
- Recreation, sport and culture, 1.6 percent from 1.7 percent; and
- Personal care, and miscellaneous goods and services, 3.5 percent from 3.6 percent.
The rest of the commodity groups retained their annual rates in January 2024. (Table B)
Main Contributors to the Headline Inflation
The top three commodity groups contributing to the February 2024 overall inflation were the following:
- Food and non-alcoholic beverages with 80.9 percent share or 3.2 percentage points;
- Alcoholic beverages and tobacco with 7.5 percent share or 0.3 percentage points; and
- Restaurants and accommodation services with 5.1 percent share or 0.2 percentage points.
Table B. Inflation Rates by Commodity Group in Misamis Oriental,
in Percent: February 2023 and January to February 2024
(2018 = 100)
| Commodity Group | Feb 2023 | Jan 2024 | Feb 2024 |
| All Items | 8.2 | 3.4 | 4.0 |
| Food and Non-Alcoholic Beverages | 12.5 | 6.7 | 7.2 |
| Alcoholic Beverages and Tobacco | 3.7 | 7.3 | 10.6 |
| Clothing and Footwear | 6.0 | 1.8 | 1.1 |
| Housing, Water, Electricity, Gas and Other Fuels | 5.8 | -0.4 | -0.2 |
| Furnishings, Household Equipment and Routine Household Maintenance | 4.3 | 0.9 | 2.0 |
| Health | 3.6 | 0.1 | -0.1 |
| Transport | 4.4 | 0.0 | 0.9 |
| Information and Communication | 2.4 | -1.7 | -1.7 |
| Recreation, Sport and Culture | 2.6 | 1.7 | 1.6 |
| Education Services | 1.8 | 0.1 | 0.1 |
| Restaurants and Accommodation Services | 5.2 | 2.3 | 3.1 |
| Financial Services | 0.0 | -0.1 | -0.1 |
| Personal Care, and Miscellaneous Goods and Services | 7.9 | 3.6 | 3.5 |
Source: Philippine Statistics Authority, Retail Price Survey of Commodities for the Generation of Consumer Price Index
Food Inflation
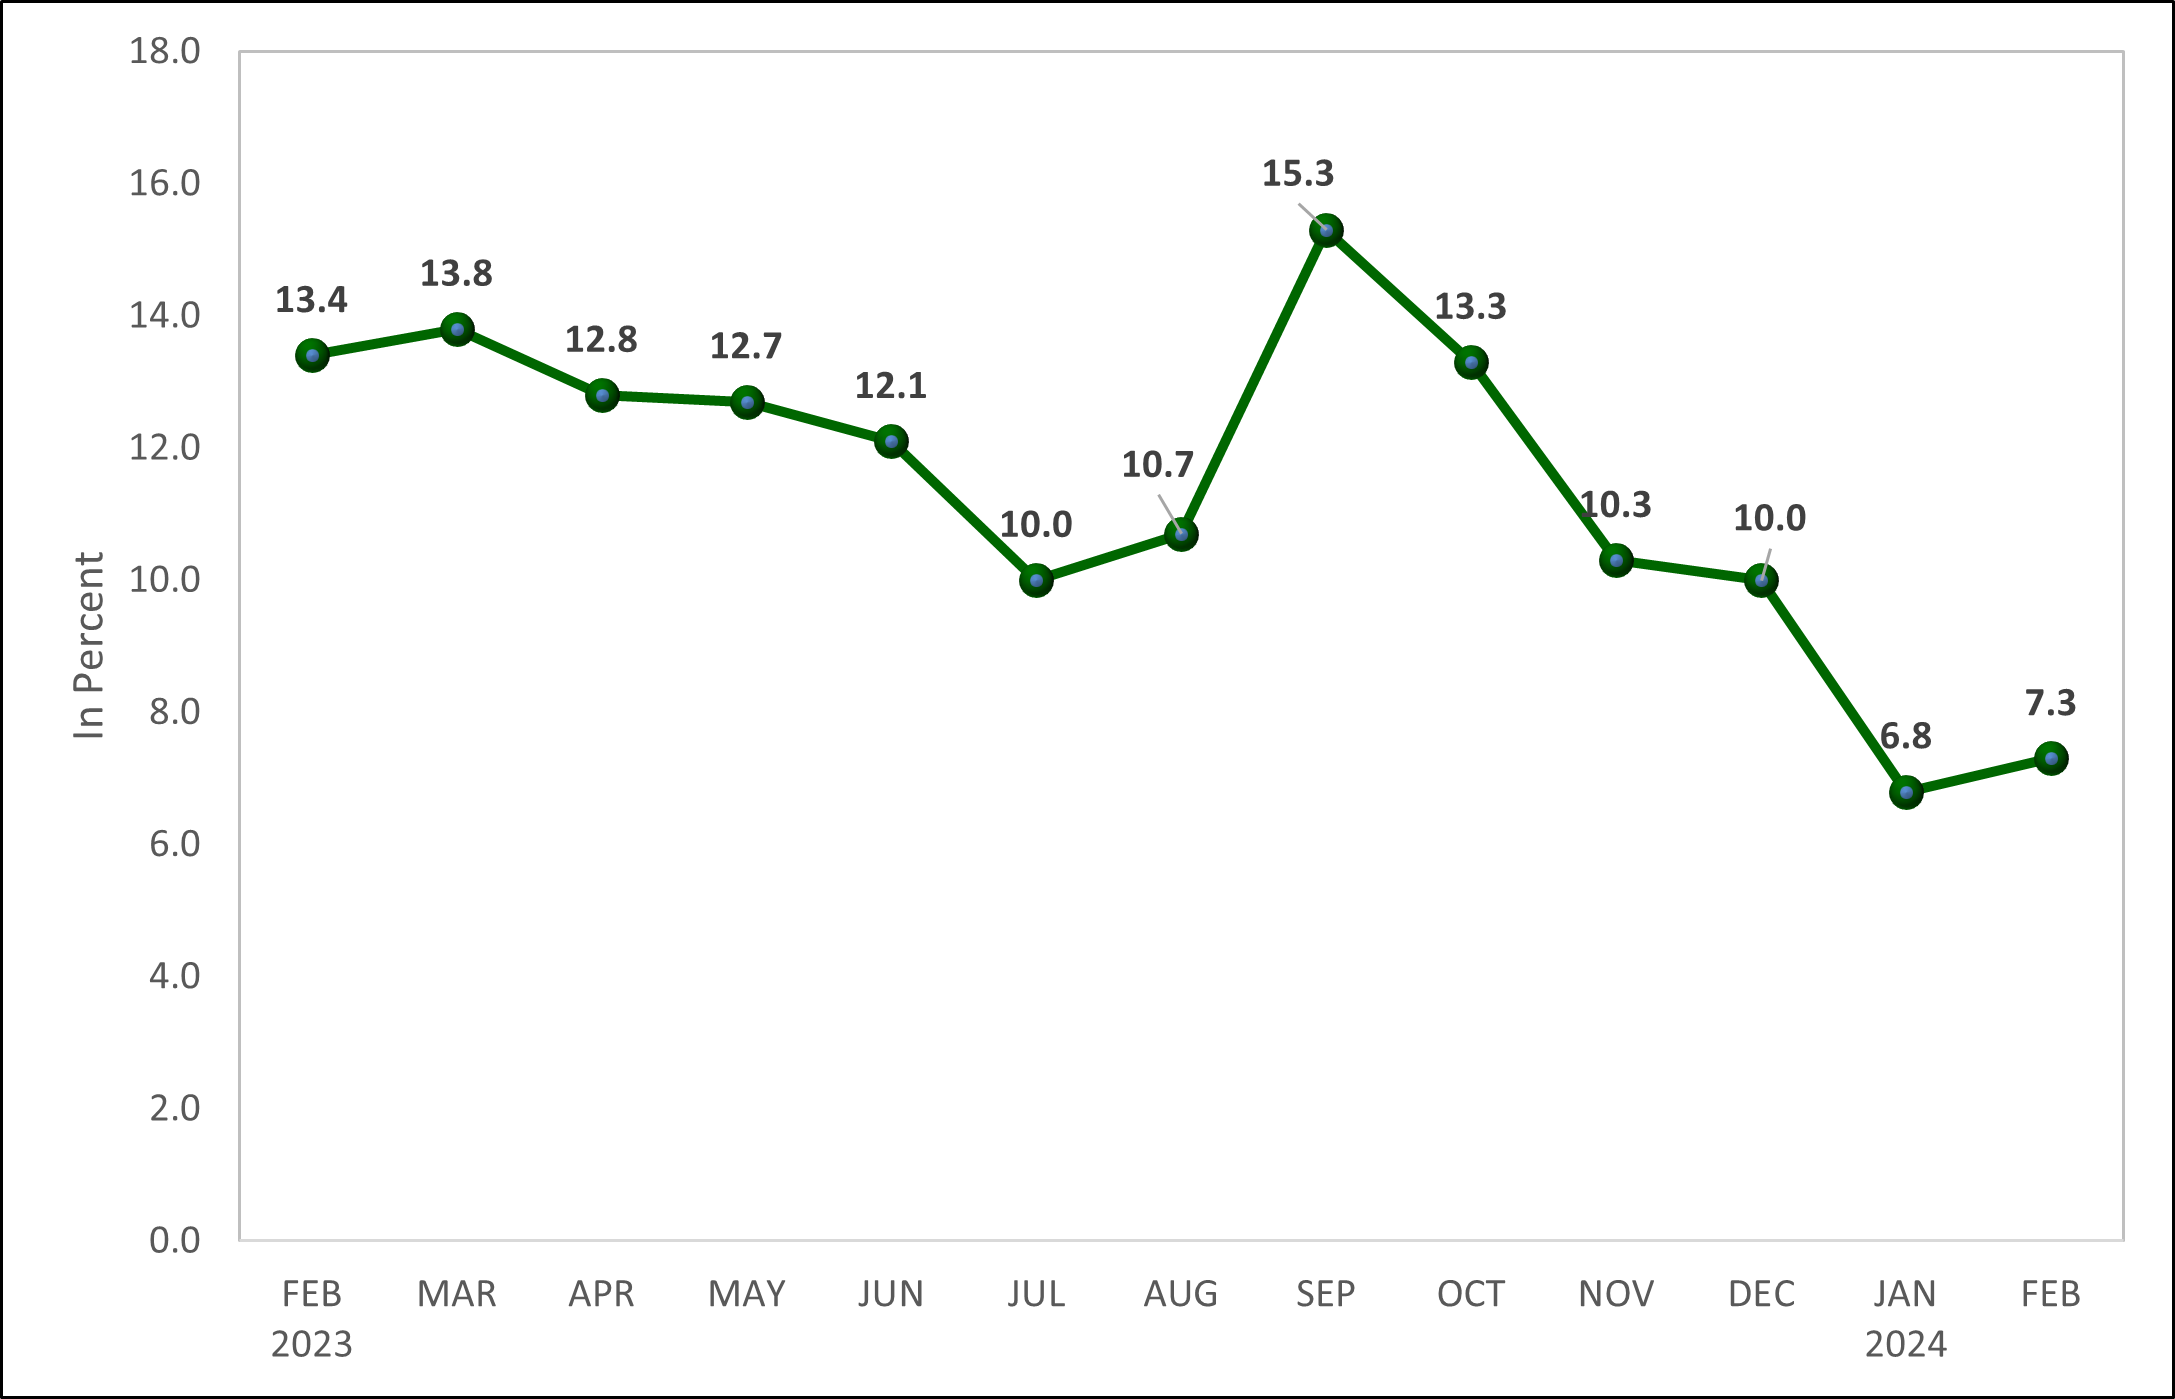
Food inflation in Misamis Oriental inclined to 7.3 percent in February 2024 from 6.8 percent in the previous month. In February 2023, food inflation was higher at 13.4 percent. (Figure 2)
As shown in Table C, the Consumer Price Index (CPI) of food in the province recorded 137.5 in February 2024, which was higher than the CPI in February 2023 and January 2024 at 128.2 and 136.0, respectively. On average, prices have increased by 37.5 percent since the base year of 2018, when the CPI was at 100. The base year serves as a reference point for comparison to see how much prices have changed over time.
Figure 2. Food Inflation Rates in Misamis Oriental:
February 2023 to February 2024
(2018=100)
Source: Philippine Statistics Authority, Retail Price Survey of Commodities for the Generation of Consumer Price Index
Main Drivers to the Upward Trend of the Food Inflation
The faster year-on-year increase of cereals and cereal products—which increased to 19.9 percent in February 2024 from 15.8 percent in January 2024—was the primary cause of the acceleration of food inflation.
Other food groups that contributed to the increasing trend during the month were:
- Fruits and nuts, 17.2 percent from 10.6 percent;
- Ready-made food and other food products n.e.c., 6.3 percent from 5.3 percent;
- Milk, other dairy products and eggs, 5.7 percent from 5.4 percent; and
- Oils and fats, 0.0 percent from -0.2 percent.
In contrast, four food groups recorded lower inflation during the month:
- Meat and other parts of slaughtered land animals, 1.9 percent from 3.1 percent;
- Fish and other seafood, 3.0 percent from 6.3 percent;
- Vegetables, tubers, plantains, cooking bananas and pulses, -12.7 percent from -10.3 percent; and
- Sugar, confectionery and desserts, -0.7 percent from 0.1 percent.
Furthermore, rice inflation stepped up to 29.1 percent in February 2024 compared to the 23.0 percent in the previous month. Similarly, the corn inflation at 4.1 percent during the month was faster than the 1.8 percent inflation in January 2024. (Table C)
Main Contributors to the Increasing Trend of Food Inflation
Food inflation shared 75.3 percent or 3.0 percentage points to the overall inflation in February 2024. The food groups with the highest contribution to the
food inflation during the month were the following:
- Cereals and cereal products with 87.3 percent share or 6.38 percentage points;
- Fruits and nuts with 6.1 percent share or 0.45 percentage points; and
- Milk, other dairy products and eggs with 5.6 percent share or 0.41 percentage points.
Meanwhile, the remaining food groups contributed 0.07 percentage points.
Table C. Consumer Price Index, and Month-on-Month and
Year-on-Year Percent Changes by Food Group in Misamis Oriental
(2018 = 100)
| Commodity Group | Consumer Price Index (CPI) | Inflation Rates (in %) | |||
| Feb 2023 | Jan 2024 | Feb 2024 | Jan 2024 | Feb 2024 | |
| Food | 128.2 | 136.0 | 137.5 | 6.8 | 7.3 |
| Cereals and Cereal Products | 98.2 | 113.7 | 117.7 | 15.8 | 19.9 |
| Cereals | 93.6 | 111.4 | 116.2 | 18.8 | 24.2 |
| Rice | 87.3 | 107.7 | 112.7 | 23.0 | 29.1 |
| Corn | 132.2 | 134.3 | 137.6 | 1.8 | 4.1 |
| Flour, Bread and Other Bakery Products, Pasta Products, and Other Cereals | 124.2 | 126.7 | 126.7 | 2.5 | 2.0 |
| Meat And Other Parts of Slaughtered Land Animals | 155.5 | 159.2 | 158.5 | 3.1 | 1.9 |
| Fish And Other Seafood | 154.7 | 159.8 | 159.4 | 6.3 | 3.0 |
| Milk, Other Dairy Products and Eggs | 116.6 | 123.4 | 123.2 | 5.4 | 5.7 |
| Oils And Fats | 118.8 | 118.6 | 118.8 | -0.2 | 0.0 |
| Fruits And Nuts | 151.5 | 170.0 | 177.6 | 10.6 | 17.2 |
| Vegetables, Tubers, Plantains, Cooking Bananas and Pulses | 179.8 | 159.1 | 156.9 | -10.3 | -12.7 |
| Sugar, Confectionery and Desserts | 151.6 | 152.1 | 150.5 | 0.1 | -0.7 |
| Ready-Made Food and Other Food Products N.E.C. | 129.7 | 137.7 | 137.9 | 5.3 | 6.3 |
Source: Philippine Statistics Authority, Retail Price Survey of Commodities for the Generation of Consumer Price Index
Note: CPIs and inflation rates by province and selected city are posted at the PSA OpenSTAT portal accessible at https://www.psa.gov.ph
(SGD.)MARIA LIZA M. BIGORNIA
(Chief Statistical Specialist)
Officer-In-Charge