

Livestock Inventory
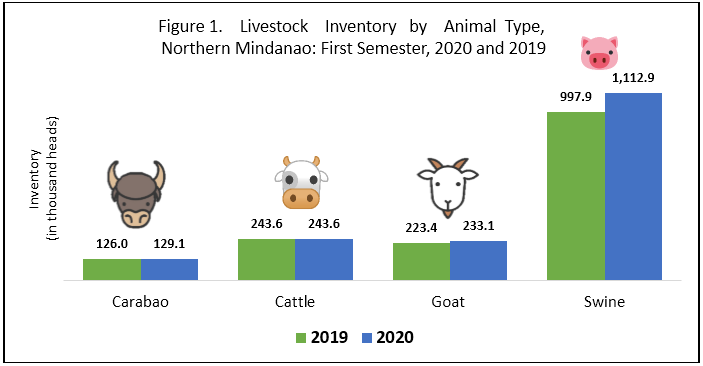
For the first semester of 2020, swine topped the livestock inventory in Northern Mindanao with 1,112,904 heads, an increase of 11.5 percent year-on-year. Goat and carabao ranked next with year-on-year increases of 4.4 percent and 2.4 percent, respectively. Cattle lagged behind with 0.01 percent increase year-on-year. (Figure 1 and Table 1)
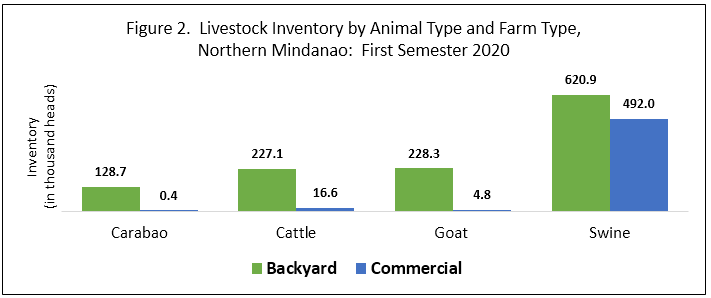
Most carabao (99.7%), cattle (93.2%) and goat (97.9%) were raised in backyard farms. Only 55.8 percent of the swine were raised in backyard farms. (Figure 2)
Livestock Production
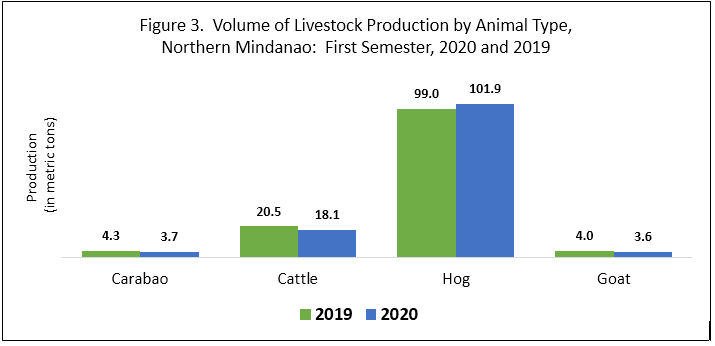
Carabao production dropped by 13.4 percent year-on-year, decreasing to 3,720 metric tons from 4,298 metric tons in the first semester of 2019. Cattle and goat production also decreased by 11.8 percent and 10.9 percent year-on-year, respectively. Hog production, on the other hand, increased to 101,912 metric tons, a 2.9 percent increase year-on-year. (Figure 3 and Table 2)
Poultry Inventory
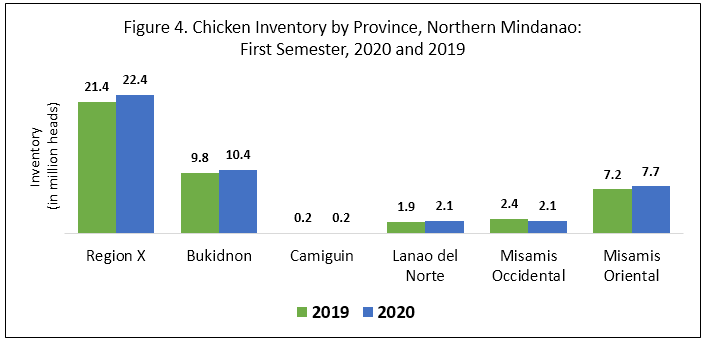
Chicken inventory increased by 4.7 percent year-on-year, recording 22,372,572 birds from 21,366,298 birds in the first semester of the previous year. All provinces recorded increases in chicken inventory except Misamis Occidental (-12.9%). (Figure 4 and Table 3)
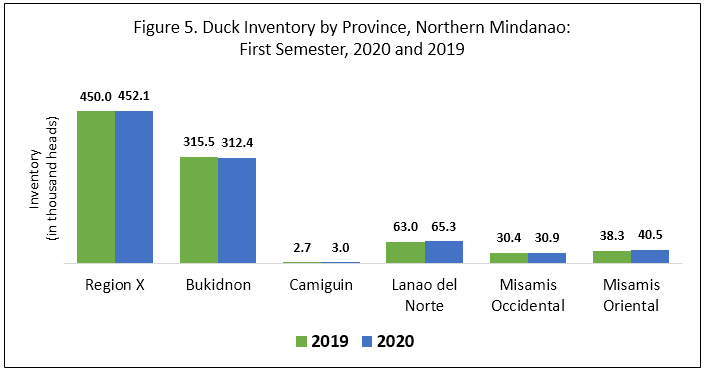
Duck inventory also grew by 0.5 percent year-on-year, increasing to 452,138 birds from 449,962 birds in the first semester of the previous year. All provinces also posted increases in duck inventory except Bukidnon (-1.0%). (Figure 5 and Table 3)
Poultry Production
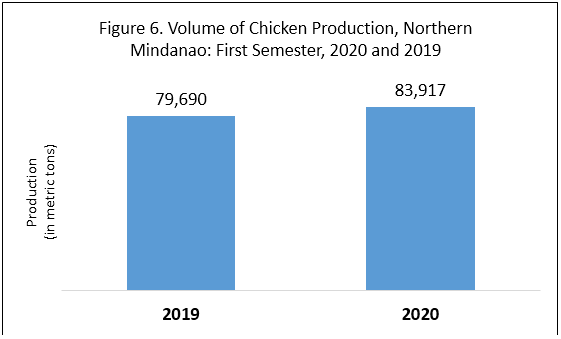
Chicken production in the region grew by 5.3 percent year-on-year, registering a production of 83,917 metric tons in the first semester of 2020. (Figure 6 and Table 4)
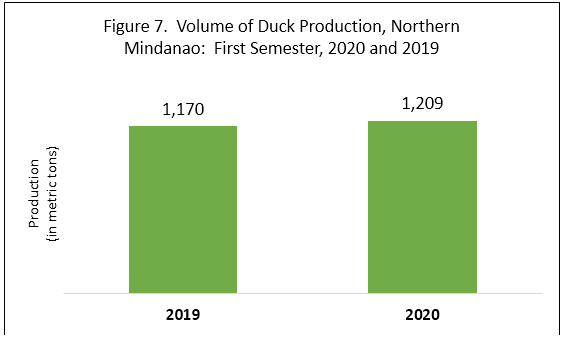
Likewise, duck production recorded an improved production of 1,209 metric tons, a 3.3 percent increase year-on-year. (Figure 7 and Table 4)
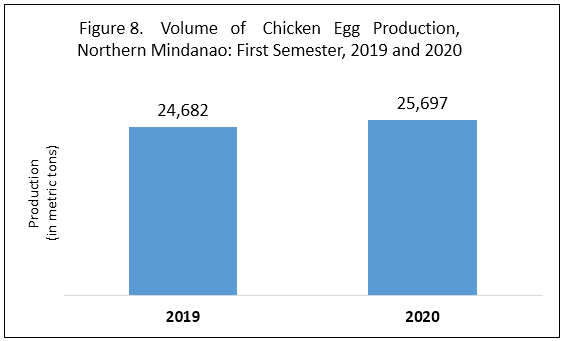
Chicken egg production in the region was estimated at 25,697 metric tons in the first semester of 2020. This translates to a 4.1 percent growth year-on-year. (Figure 8 and Table 4)
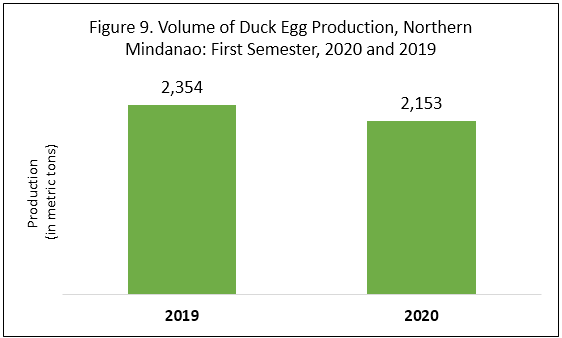
On the other hand, production of duck eggs dropped to 2,153 metric tons, a decrease of 8.5 percent year-on-year.
RUBEN D. ABARO, JR., CESE
Regional Director
SBB/BMC/JSE
For further inquiries, you may contact:
Statistical Operations & Coordination Division
Philippine Statistics Authority Regional Statistical Service Office 10
2nd Floor, Bldg. 4, Pride Rock Business Park
Gusa Highway, Cagayan de Oro City
Email: psaregion10@gmail.com
Telefax: (088) 856-4778
TECHNICAL NOTES
The data for this special release were collected by the Philippine Statistics Authority (PSA) through two (2) major surveys:
- Backyard Livestock and Poultry Survey (BLPS).
This survey which covers one (1) of the four replicate samples of the Palay and Corn Production Survey (PCPS).
- Commercial Livestock and Poultry Survey (CLPS).
A livestock farm is considered commercial when its operation satisfies at least one of the following conditions: a) at least 21 heads of adults and zero young, b) at least 41 heads of young animals, or c) at least 10 heads of adults and 22 heads of young animals. A poultry farm is considered commercial when its operation satisfies at least one of the following conditions: a) at least 500 layers, b) at least 1,000 broilers, or c) 100 layers and 100 broilers, if raised in combination. A duck farm is considered commercial if it has a raising capacity of at least 100 birds of duck regardless of age.
Data collection for swine and chicken is done quarterly while data collection is done semi-annually for goat, cattle, carabao, and duck farms. BLPS is conducted during the first seven (7) days of the first month after the reference quarter while CLPS is conducted during the last eight (8) days of the last month of the reference quarter or semester.
CONCEPTS AND DEFINITIONS
Volume of production refers to the volume of locally-raised animals disposed for dressing including those which were shipped out to other regions/provinces for slaughter or dressing. This is expressed in thousand metric tons, liveweight
Inventory refers to the actual number of animals present in the farm as of the specific reference date.