Table A. Year-on-Year Headline Inflation Rates for
All Income Households, All Items in Percent
(2018=100)
AREA
| MAR 2024 | FEB 2025 | MAR 2025 | YEAR-TO-DATE* |
| Philippines | 3.7 | 2.1 | 1.8 | 2.2 |
| Region X | 3.9 | 1.8 | 1.1 | 2.0 |
| Misamis Oriental | 3.8 | 3.9** | 3.0 | 4.1 |
| Source: Philippine Statistics Authority, Retail Price Survey of Commodities for the Generation of Consumer Price Index * Year-on-year change of CPI for January to March 2025 vs 2024 ** Revised as of March 2025 | ||||
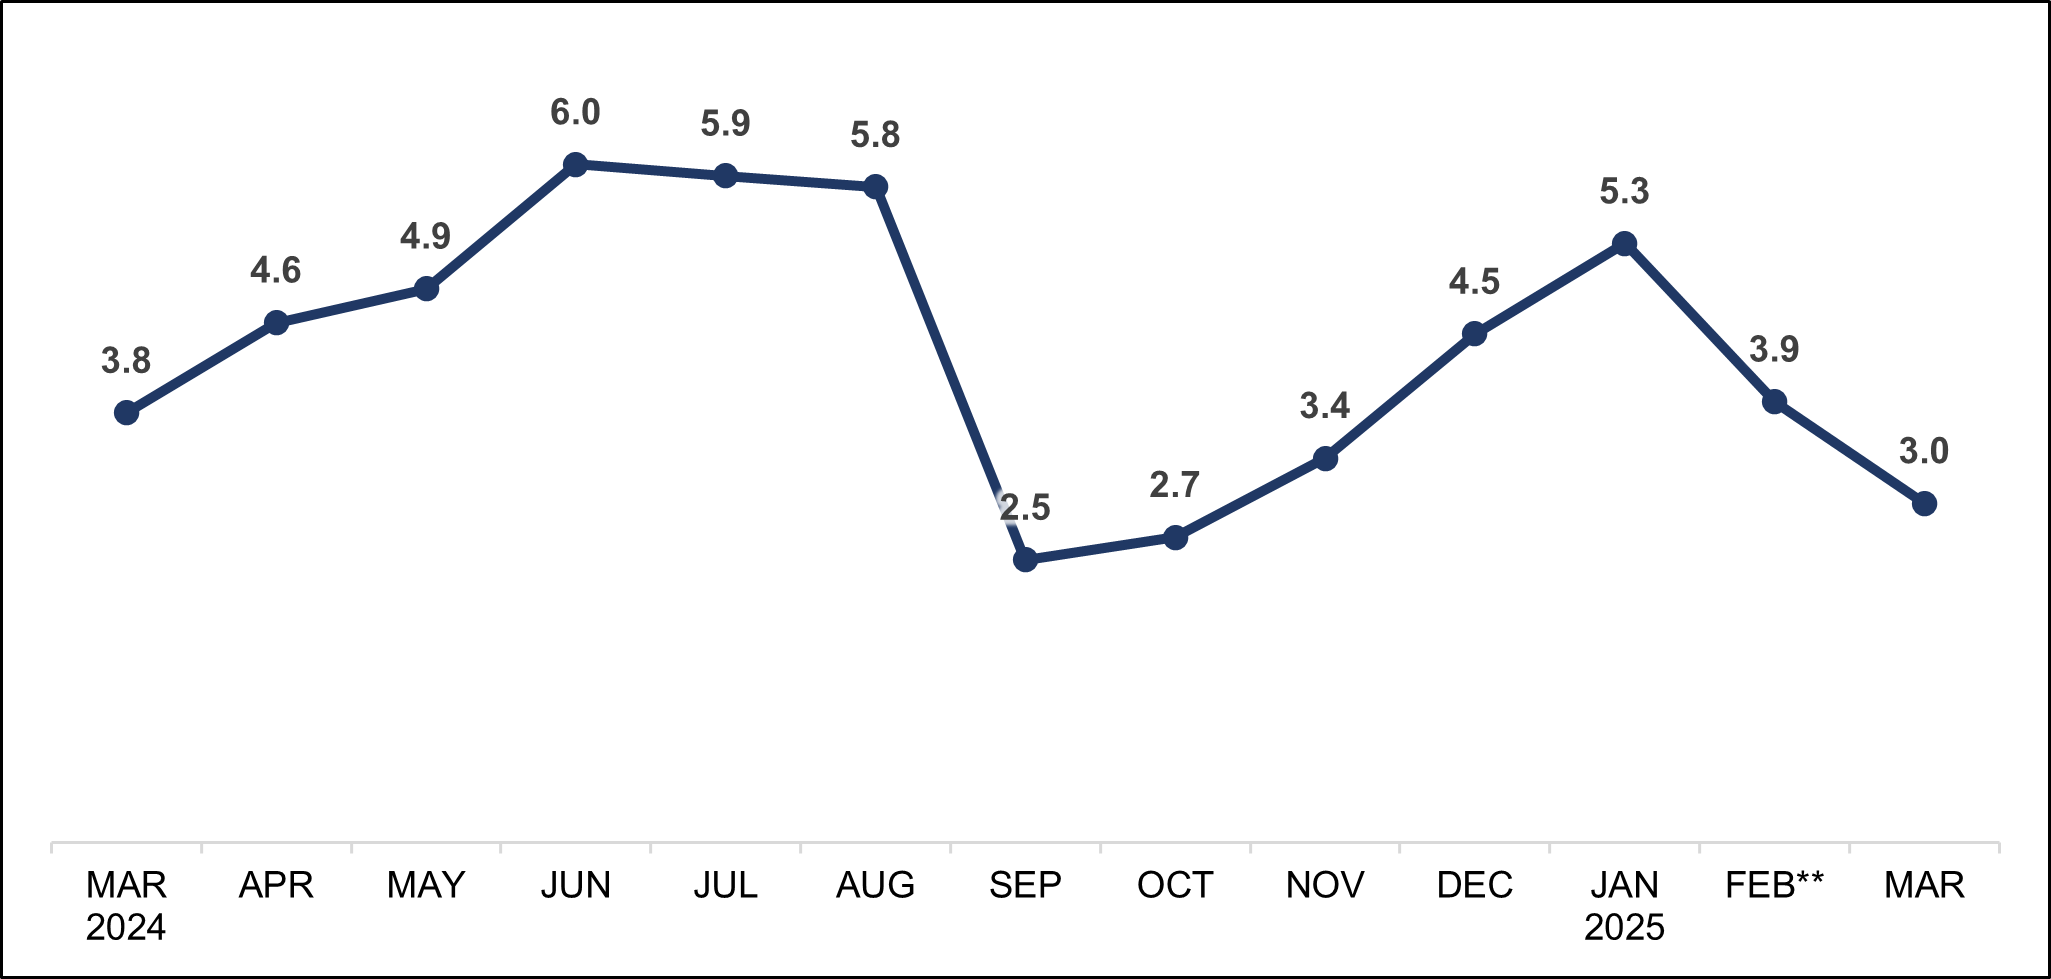
Figure 1. Year-on-Year Headline Inflation Rates in Misamis Oriental for
All Income Households, All Items in Percent
(2018=100)
Source: Philippine Statistics Authority, Retail Price Survey of Commodities for the Generation of Consumer Price Index
** Revised as of March 2025
HEADLINE INFLATION
The headline inflation, or overall inflation, for all income households in Misamis Oriental eased further to 3.0 percent in March 2025 from 3.9 percent in the previous month. This brought about the 4.1 percent average inflation of the province from January to March 2025. In addition, the provincial average inflation was higher than the national and regional averages by 1.9 and 2.1 percentage points, respectively. In March 2025, the inflation rate was higher at 3.8 percent. (Table A and Figure 1)
I.1 MAIN DRIVERS TO THE TREND OF THE HEADLINE INFLATION
In March 2025, the downtrend in the province’s overall inflation for all income households was mainly caused by the decelerated inflation of food and non-alcoholic beverages at 1.8 percent during the month from 3.3 percent in February 2025. Also contributing to the downtrend was the lower annual increments of the following commodity groups during the month than the prior month:
Transport at 4.3 percent from 6.1 percent;
Restaurants and accommodation services at 0.8 percent from 1.7 percent;
Housing, water, electricity, gas and other fuels at 4.0 percent from 4.2 percent;
Clothing and footwear at 3.9 percent from 4.7 percent;
Personal care, and miscellaneous goods and services at 6.0 percent from 1 percent; and
Alcoholic beverages and tobacco at 6.0 percent from 6.1 percent.
On the contrary, a higher annual increase was observed in the following commodity groups during the month than the previous month:
Furnishings, household equipment and routine household maintenance at 0 percent from 2.3 percent;
Health at 7.7 percent from 5.9 percent; and
Recreation, sport and culture at 10.7 percent from 10.1 percent.
The indices of the rest of the commodity groups retained their respective previous month’s annual rates. (Table B)
I.2 MAIN DRIVERS TO THE HEADLINE INFLATION
The top three commodity groups contributing to the province’s overall inflation for all income households during the month were the following:
Food and non-alcoholic beverages with a 27.8 percent share or 0.83 percentage points;
Housing, water, electricity, gas and other fuels with a 25.5 percent share or 76 percentage points; and
Transport with a 12.9 percent share or 0.39 percentage points.
The rest of the commodity groups accounted for a 33.8 percent share or 1.02 percentage points. (Table B)
Table B. Year-on-Year Inflation Rates and Contribution to the Trend of the
Headline Inflation and to the Headline Inflation in Misamis Oriental for
All Income Households by Commodity Group
(2018=100)
| COMMODITY GROUP | HEADLINE INFLATION RATE (in %) | CONTRIBUTION | ||||
| MAR 2024 | FEB 2025 | MAR 2025 | TREND OF THE HEADLINE INFLATION (in %) | HEADLINE INFLATION | ||
| (in %) | (in percentage point) | |||||
| ALL ITEMS | 3.8 | 3.9** | 3.0 | 100.0 | 100.0 | 3.0 |
| Food and Non-Alcoholic Beverages | 7.1 | 3.3 | 1.8 | 69.1 | 27.8 | 0.83 |
| Alcoholic Beverages and Tobacco | 9.2 | 6.1** | 6.0 | 0.3 | 6.0 | 0.18 |
| Clothing and Footwear | 1.3 | 4.7 | 3.9 | 2.6 | 3.6 | 0.11 |
| Housing, Water, Electricity, Gas and Other Fuels | -0.6 | 4.2 | 4.0 | 4.3 | 25.5 | 0.76 |
| Furnishings, Household Equipment and Routine Household Maintenance | 1.0 | 2.3 | 4.0 | 0.0 | 3.5 | 0.10 |
| Health | 0.2 | 5.9 | 7.7 | 0.0 | 5.3 | 0.16 |
| Transport | 1.1 | 6.1 | 4.3 | 17.1 | 12.9 | 0.39 |
| Information and Communication | -1.6 | 3.4 | 3.4 | 0.0 | 2.9 | 0.09 |
| Recreation, Sport and Culture | 2.2 | 10.1 | 10.7 | 0.0 | 1.9 | 0.06 |
| Education Services | 0.1 | 0.0 | 0.0 | 0.0 | 0.0 | 0.00 |
| Restaurants and Accommodation Services | 3.4 | 1.7 | 0.8 | 6.1 | 1.8 | 0.05 |
| Financial Services | -0.1 | 0.0 | 0.0 | 0.0 | 0.0 | 0.00 |
| Personal Care, and Miscellaneous Goods and Services | 3.0 | 6.1** | 6.0 | 0.5 | 8.9 | 0.27 |
| Source: Philippine Statistics Authority, Retail Price Survey of Commodities for the Generation of Consumer Price Index Note: Details may not add up due to rounding. ** Revised as of March 2025 | ||||||
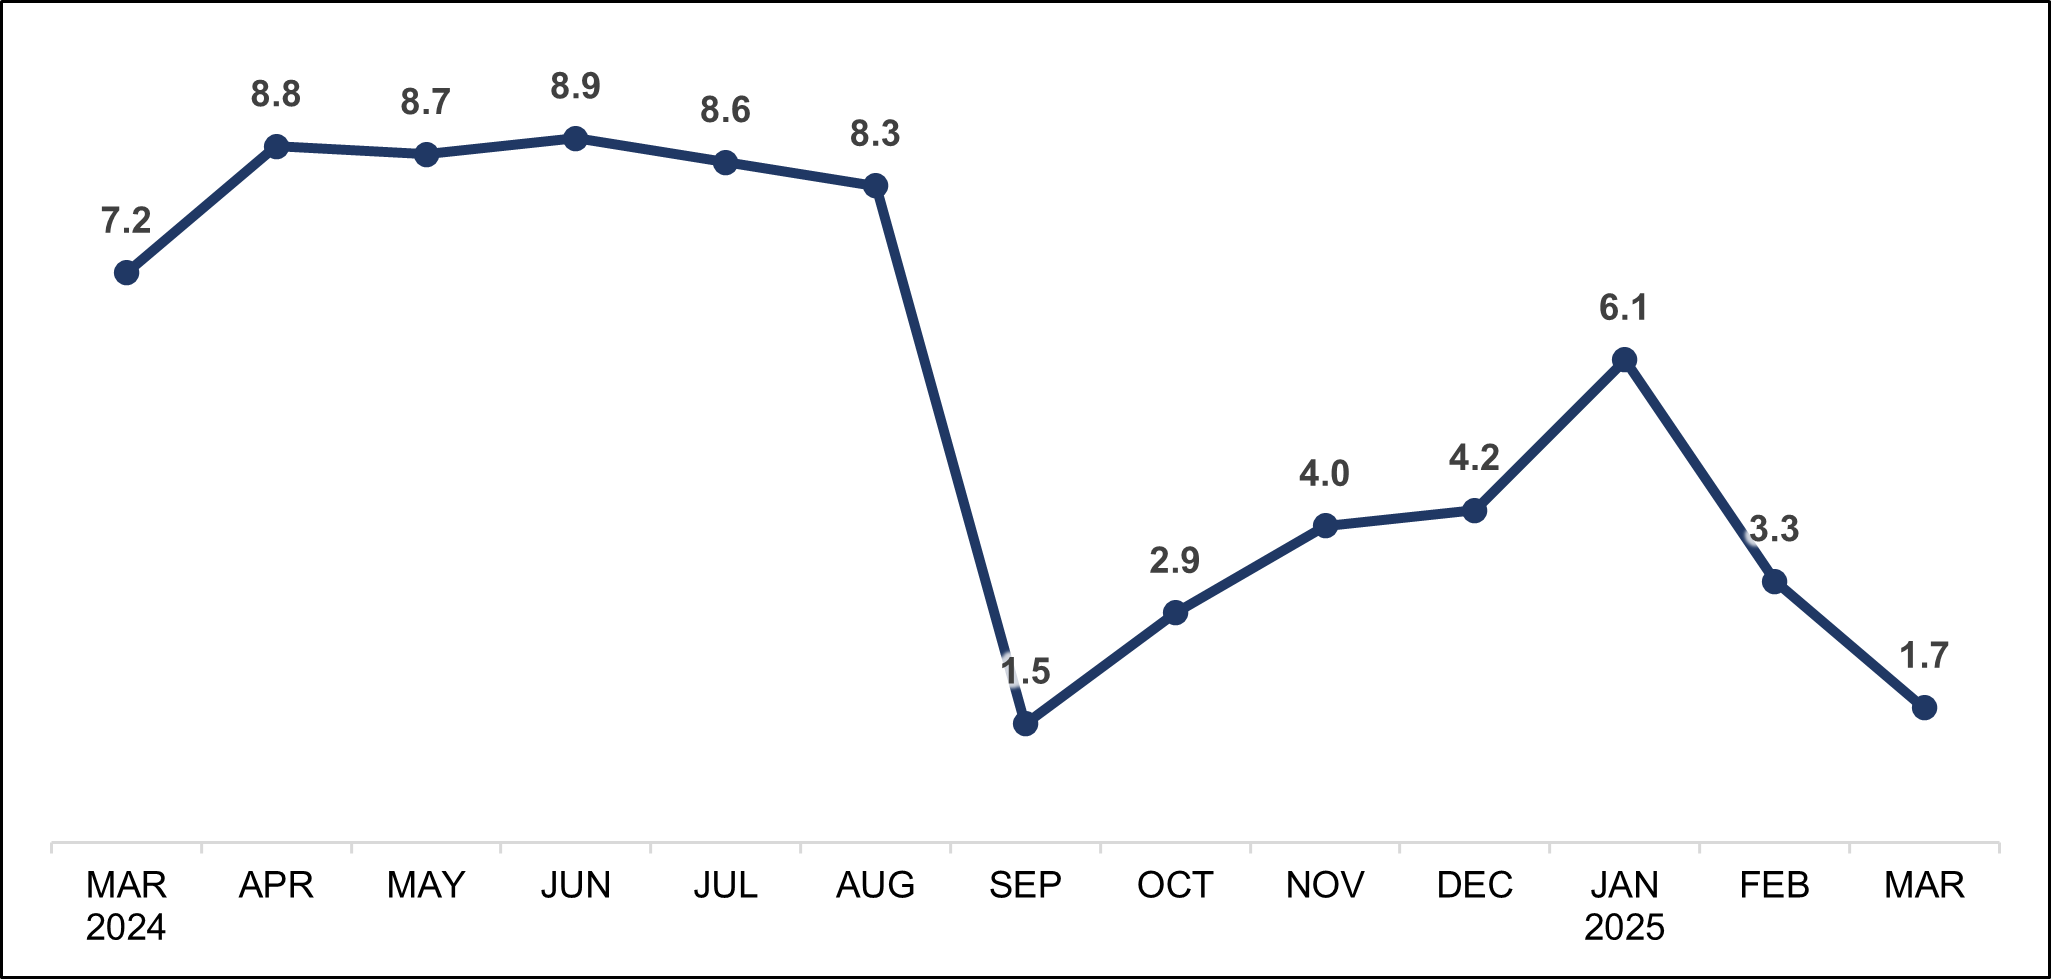
Figure 2. Year-on-Year Food Inflation Rates in Misamis Oriental for
All Income Households, All Items in Percent
(2018=100)
Source: Philippine Statistics Authority, Retail Price Survey of Commodities for the Generation of Consumer Price Index
FOOD INFLATION
The food inflation for all income households in the province slowed down further to 1.7 percent in March 2025 from 3.3 percent in February 2025. (Figure 2)
II.1 MAIN DRIVERS TO THE TREND OF THE FOOD INFLATION
Cereals and cereal products declined by 0.7 percent in March 2025 from 2.7 percent in the previous month which primarily influenced the downtrend of the province’s food inflation for all income households. In addition, lower inflation rates were noted in the indices of the following food items during the month than in the preceding month:
Fish and other seafood at -4.8 percent from -3.1 percent;
Vegetables, tubers, plantains, cooking bananas and pulses at 0.6 percent from 3.3 percent;
Fruits and nuts at 27.9 percent from 31.2 percent; and
Ready-made food and other food products n.e.c. at -1.5 percent from 0 percent.
In contrast, higher annual growth rates were observed in the indices of the following food groups during the month than the prior month:
Meat and other parts of slaughtered land animals at 2.9 percent from 1 percent;
Milk, other dairy products and eggs at 13.2 percent from 12.5 percent;
Oils and fats at 0.8 percent from -0.5 percent; and
Sugar, confectionery and desserts at -2.0 percent from -4.5 percent. (Table C)
II.2 MAIN DRIVERS TO THE FOOD INFLATION
The top three commodity groups contributing to the province’s food inflation for all income households during the month were the following:
Fruits and nuts with a 72.8 percent share or 1.24 percentage points;
Milk, other dairy products and eggs with a 63.5 percent share or 08 percentage points;
Meat and other parts of slaughtered land animals with a 31.0 percent share or 0.53 percentage points.
The remaining food groups shared -67.3 percent or contributed -1.14 percentage points. (Table C)
Table C. Year-on-Year Inflation Rates and Contribution to the Trend of the Food Inflation
and to the Food Inflation in Misamis Oriental for All Income Households by Food Group
(2018=100)
| COMMODITY GROUP | FOOD INFLATION RATE (in %) | CONTRIBUTION | ||||
|---|---|---|---|---|---|---|
| MAR 2024 | FEB 2025 | MAR 2025 | TREND OF THE FOOD INFLATION (in %) | FOOD INFLATION | ||
| (in %) | (in percentage point) | |||||
| FOOD | 7.2 | 3.3 | 1.7 | 100.0 | 100.0 | 1.7 |
Cereals and Cereal Products | 21.1 | 2.7 | -0.7 | 69.2 | -15.7 | -0.27 |
| Cereals | 25.4 | 2.6 | -1.8 | |||
| Rice | 30.7 | 2.0 | -1.8 | |||
| Corn | 4.3 | 5.7 | -1.8 | |||
| Flour, Bread and Other Bakery Products, Pasta Products, and Other Cereals | 2.3 | 3.0 | 4.9 | |||
Meat and Other Parts of Slaughtered Land Animals | 1.2 | 2.1 | 2.9 | 0.0 | 31.0 | 0.53 |
Fish and Other Seafood | -0.4 | -3.1 | -4.8 | 12.8 | -48.9 | -0.83 |
| Milk, Other Dairy Products, and Eggs | 4.6 | 12.5 | 13.2 | 0.0 | 63.5 | 1.08 |
| Oils and Fats | -4.0 | -0.5 | 0.8 | 0.0 | 0.6 | 0.01 |
| Fruits and Nuts | 19.7 | 31.2 | 27.9 | 5.4 | 72.8 | 1.24 |
| Vegetables, Tubers, Cooking Bananas and Pulses | -9.9 | 3.3 | 0.6 | 9.6 | 2.8 | 0.05 |
| Sugar, Confectionery and Desserts | -3.5 | -4.5 | -2.0 | 0.0 | -2.5 | -0.04 |
| Ready-Made Food and Other Food Products N.E.C. | 5.2 | 0.0 | -1.5 | 2.9 | -3.5 | -0.06 |
| Source: Philippine Statistics Authority, Retail Price Survey of Commodities for the Generation of Consumer Price Index Note: Details may not add up due to rounding. | ||||||
Notes:
The Consumer Price Index (CPI) for all income households is compiled to measure the changes in prices of commodities commonly purchased by families in all income classes. Furthermore, this report highlights the headline inflation, which measures changes in the cost of living based on movements in the prices of all items in the market basket.
CPIs and inflation rates by province and selected city are posted at the PSA OpenSTAT portal at https://openstat.psa.gov.ph/database.
(SGD.)MARIA LIZA M. BIGORNIA
(Chief Statistical Specialist)
Officer-In-Charge
MLG