Table A. Year-on-Year Inflation Rates for the
Bottom 30% Income Households, All Items in Percent
(2018=100)
| AREA | MAR 2024 | FEB 2025 | MAR 2025 | YEAR-TO-DATE* |
| Philippines | 4.6 | 1.5 | 1.1 | 1.7 |
| Region X | 4.9 | 3.8 | 2.2 | 2.0 |
| Misamis Oriental | 4.9 | 3.8 | 2.2 | 4.0 |
| Source: Philippine Statistics Authority, Retail Price Survey of Commodities for the Generation of Consumer Price Index * Year-on-year change of CPI for January to March 2025 vs 2024 | ||||
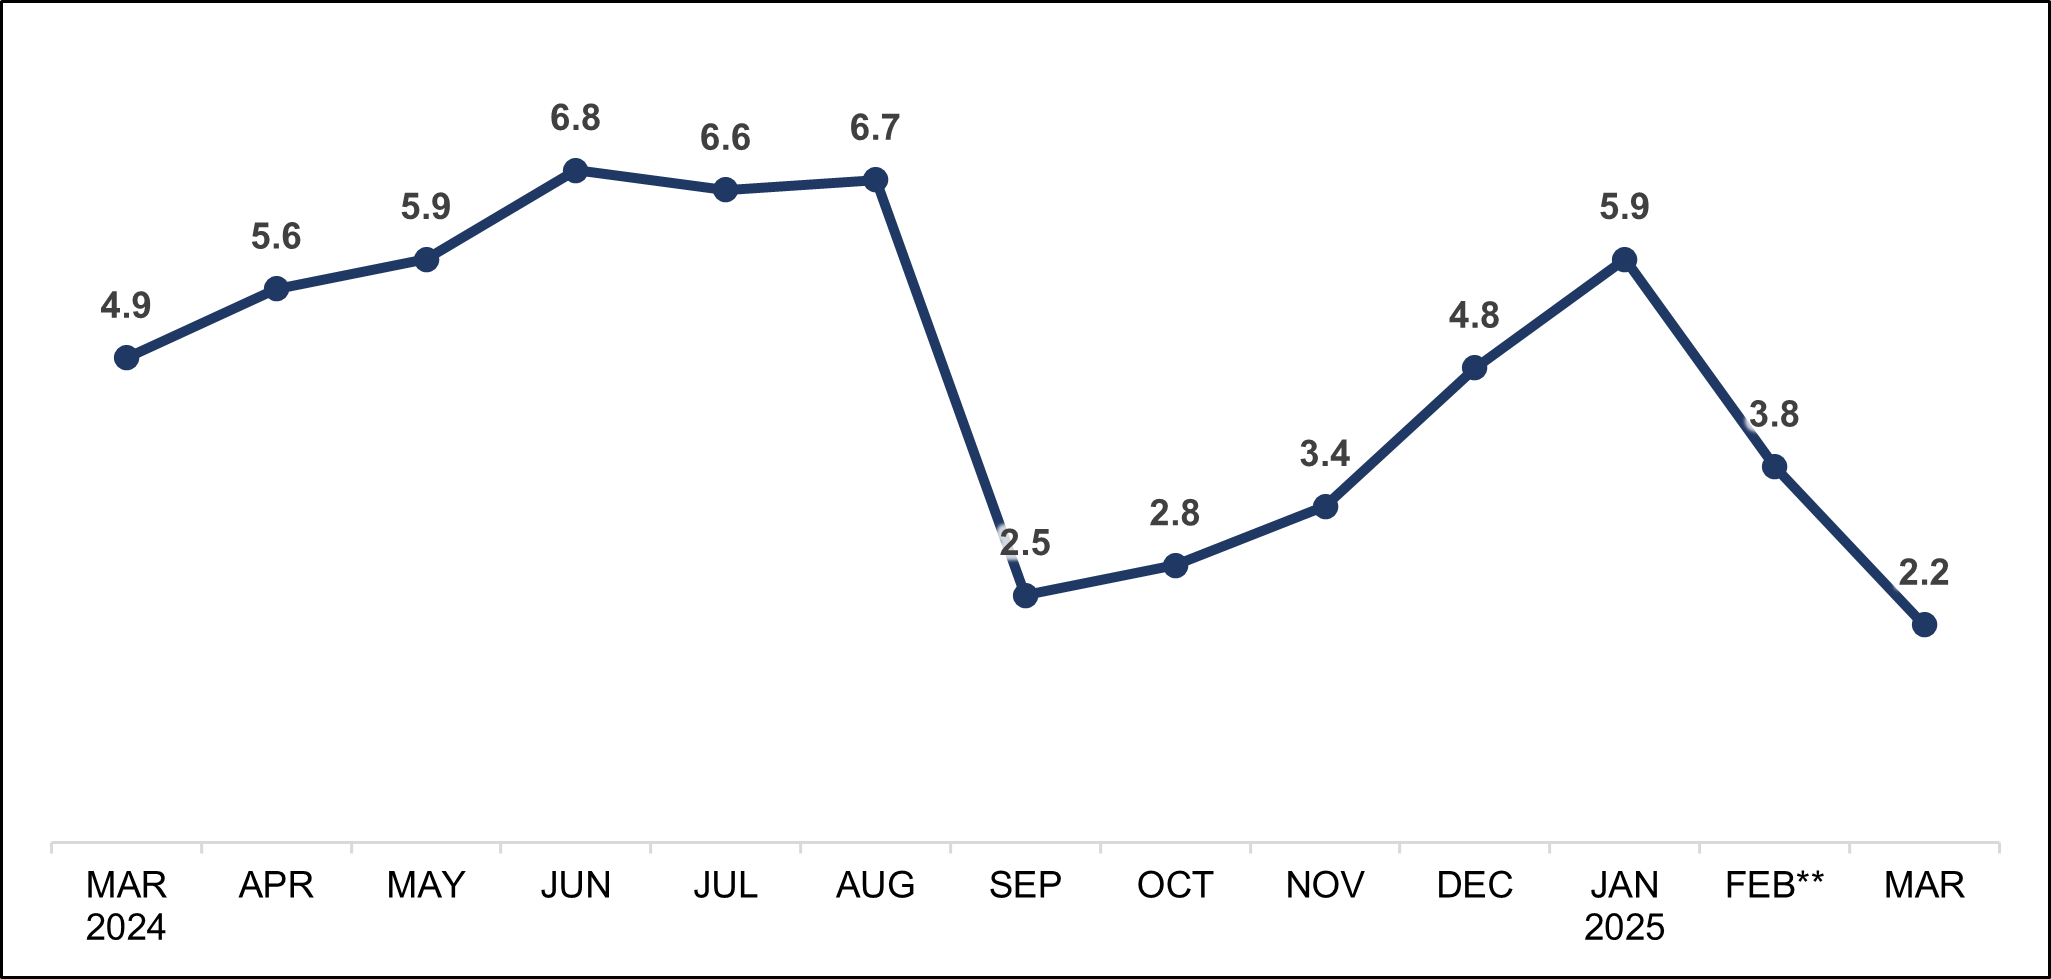
Figure 1. Year-on-Year Inflation Rates in Misamis Oriental for the
Bottom 30% Income Households, All Items in Percent
(2018=100)
Source: Philippine Statistics Authority, Retail Price Survey of Commodities for the Generation of Consumer Price Index
** Revised as of March 2025
OVERALL INFLATION
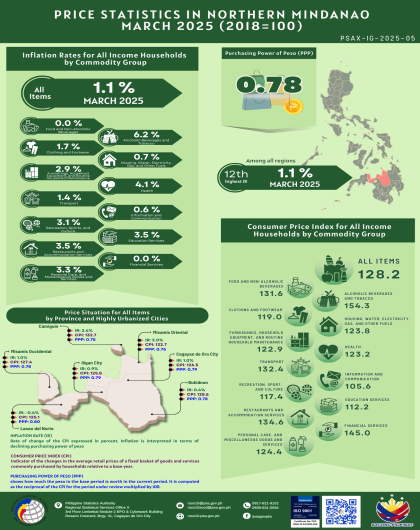
The overall inflation rate for the bottom 30% income households in Misamis Oriental slowed down further to 2.2 percent in March 2025 from 3.8 percent in the previous month. In March 2024, the inflation rate registered at 4.9 percent. (Table A and Figure 1)
I.1 MAIN DRIVERS TO THE TREND OF THE OVERALL INFLATION
The decelerated inflation of food and non-alcoholic beverages at 0.5 percent in March 2025 from 3.1 percent in February 2025 mainly influenced the province’s downtrend in overall inflation for the bottom 30% income households during the month. Moreover, lower annual rates were noted in the indices of the following commodity groups during the month than the preceding month:
Transport at 2.5 percent from 3.7 percent;
Restaurants and accommodation services at 0.7 percent from 1.7 percent;
Housing, water, electricity, gas and other fuels at 4.7 percent from 5.0 percent;
Clothing and footwear at 4.8 percent from 5.6 percent;
Alcoholic beverages and tobacco at 4.4 percent from 4.6 percent; and
Furnishings, household equipment and routine household maintenance at 9 percent from 4.1 percent.
In contrast, faster inflation rates were noted in the following commodity groups during the month than in the prior month:
Health at 4.1 percent from 3.8 percent;
Recreation, sport and culture at 13.5 percent from 13.2 percent; and
Personal care, and miscellaneous goods and services at 8.0 percent from 9 percent.
The indices of the rest of the commodity groups retained their respective previous month’s annual rates. (Table B)
I.2 MAIN DRIVERS TO THE OVERALL INFLATION
The following commodity groups were the top three contributors to the province’s overall inflation for the bottom 30% income households:
Housing, water, electricity, gas and other fuels with a 34.9 percent share or 77 percentage points;
Personal care, and miscellaneous goods and services with a 15.5 percent share or 0.34 percentage points; and
Food and non-alcoholic beverages with a 13.0 percent share or 29 percentage points.
The rest of the commodity groups accounted for a 36.6 percent share or 0.81 percentage points. (Table B)
Table B. Year-on-Year Inflation Rates and Contribution to the Trend of the
Overall Inflation and to the Overall Inflation in Misamis Oriental for the
Bottom 30% Income Households by Commodity Group
(2018=100)
| COMMODITY GROUP | OVERALL INFLATION RATE (in %) | CONTRIBUTION | ||||
| MAR 2024 | FEB 2025 | MAR 2025 | TREND OF THE OVERALL INFLATION (in %) | OVERALL INFLATION | ||
| (in %) | (in percentage point) | |||||
| ALL ITEMS | 4.9 | 3.8** | 2.2 | 100.0 | 100.0 | 2.2 |
| Food and Non-Alcoholic Beverages | 7.9 | 3.1 | 0.5 | 86.3 | 13.0 | 0.29 |
| Alcoholic Beverages and Tobacco | 11.7 | 4.6** | 4.4 | 0.4 | 7.1 | 0.16 |
| Clothing and Footwear | 2.6 | 5.6 | 4.8 | 1.1 | 4.3 | 0.09 |
| Housing, Water, Electricity, Gas and Other Fuels | -2.1 | 5.0 | 4.7 | 3.3 | 34.9 | 0.77 |
| Furnishings, Household Equipment and Routine Household Maintenance | 2.0 | 4.1 | 3.9 | 0.2 | 3.0 | 0.07 |
| Health | 1.7 | 3.8 | 4.1 | 0.0 | 2.3 | 0.05 |
| Transport | 1.0 | 3.7 | 2.5 | 5.1 | 7.9 | 0.17 |
| Information and Communication | 0.6 | 0.0 | 0.0 | 0.0 | 0.0 | 0.00 |
| Recreation, Sport and Culture | 1.7 | 13.2 | 13.5 | 0.0 | 10.0 | 0.22 |
| Education Services | 0.0 | 0.1 | 0.1 | 0.0 | 0.0 | 0.00 |
| Restaurants and Accommodation Services | 3.4 | 1.7 | 0.7 | 3.6 | 2.0 | 0.04 |
| Financial Services | 0.0 | 0.0 | 0.0 | 0.0 | 0.0 | 0.00 |
| Personal Care, and Miscellaneous Goods and Services | 4.4 | 7.9** | 8.0 | 0.0 | 15.5 | 0.34 |
| Source: Philippine Statistics Authority, Retail Price Survey of Commodities for the Generation of Consumer Price Index Note: Details may not add up due to rounding. ** Revised as of March 2025 | ||||||
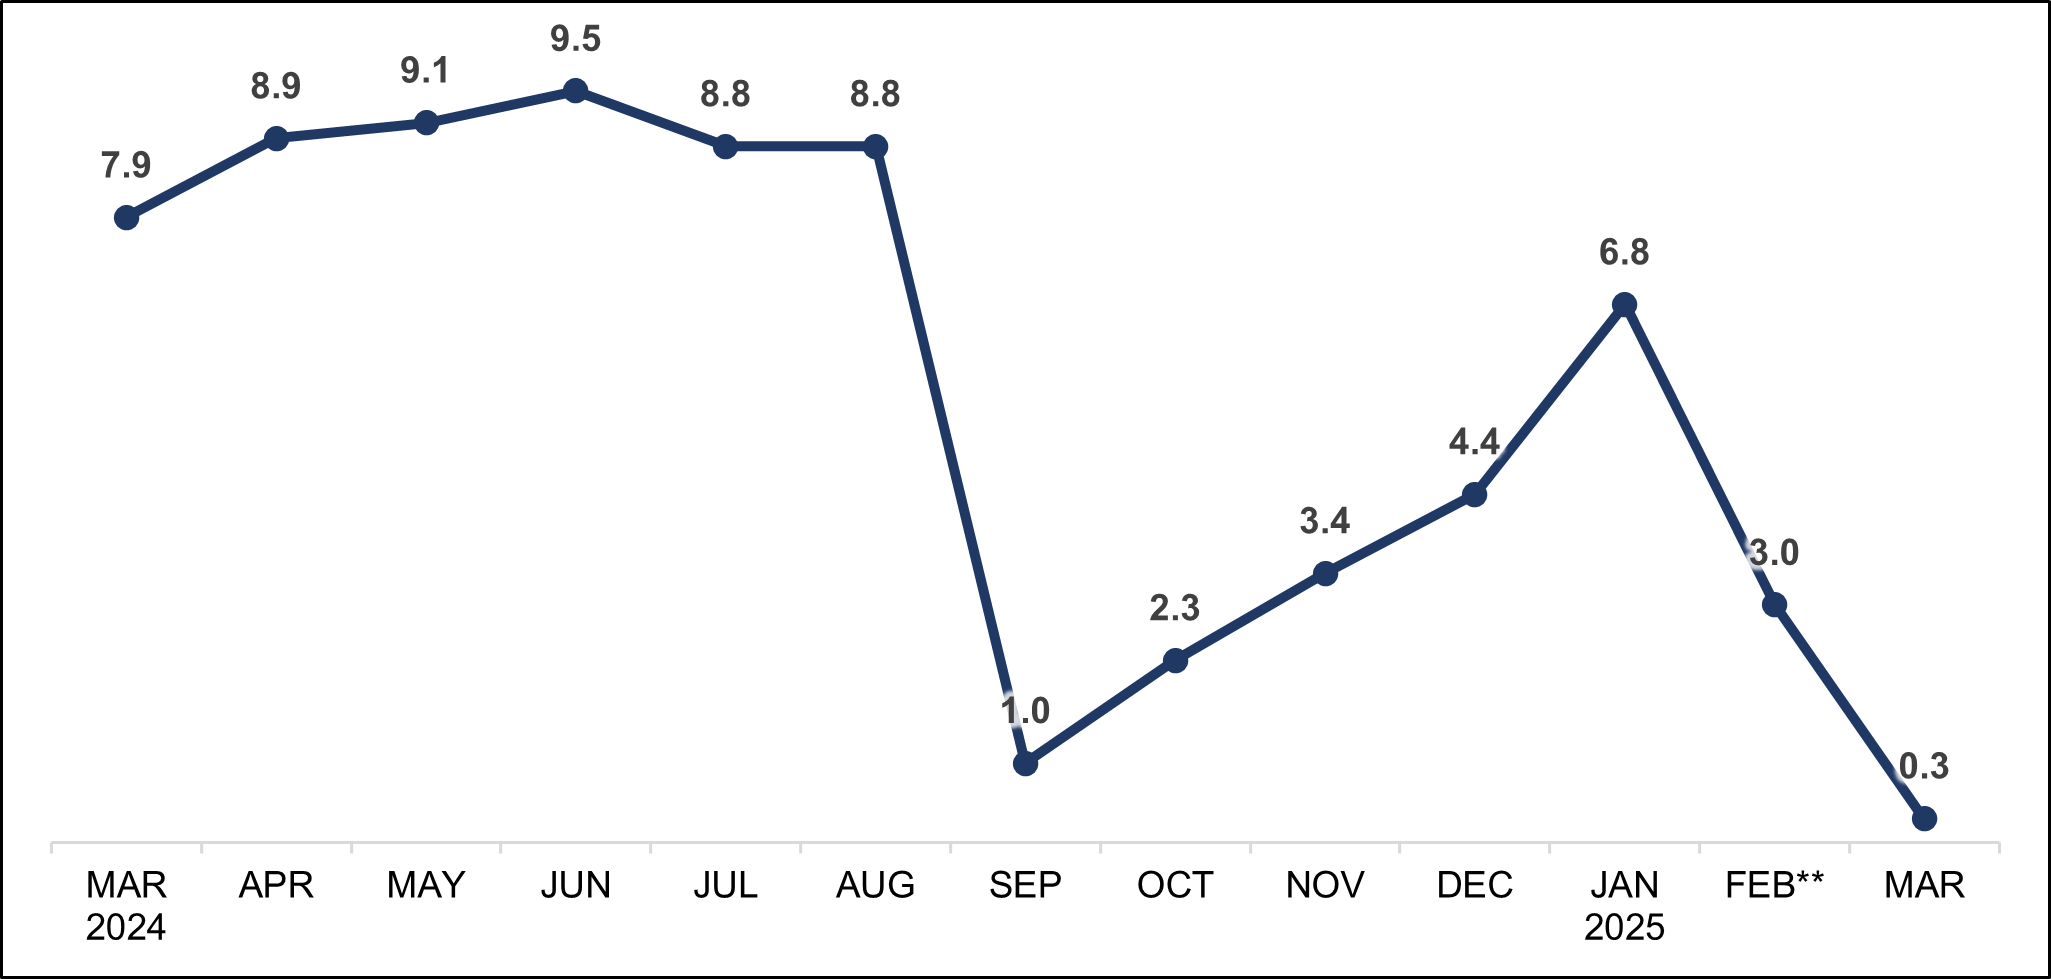
Figure 2. Year-on-Year Food Inflation Rates in Misamis Oriental for the
Bottom 30% Income Households, All Items in Percent
(2018=100)
Source: Philippine Statistics Authority, Retail Price Survey of Commodities for the Generation of Consumer Price Index
** Revised as of March 2025
FOOD INFLATION
The food inflation for the bottom 30% income households in Misamis Oriental eased down to 0.3 percent in March 2025 from 3.0 percent in February 2025. (Figure 2)
II.1 MAIN DRIVERS TO THE TREND OF THE FOOD INFLATION
In March 2025, cereals and cereal products contracted by 1.8 percent during the month from 3.3 percent in the previous month. In addition, lower inflation rates during the month were noted in the following food groups:
Fish and other seafood at -10.1 percent from -6.5 percent;
Vegetables, tubers, plantains, cooking bananas and pulses at 0.1 percent from 3.4 percent;
Fruits and nuts at 30.9 percent from 34.1 percent; and
Ready-made food and other food products n.e.c. at -2.0 percent from -0.3 percent.
In contrast, higher annual increases were noted in the following food groups:
Meat and other parts of slaughtered land animals at 3.0 percent from 0 percent;
Milk, other dairy products and eggs at 16.2 percent from 15.0 percent;
Oils and fats at -1.9 percent from -2.5 percent; and
Sugar, confectionery and desserts at 4.6 percent from 0.1 percent. (Table C)
II.2 MAIN DRIVERS TO THE FOOD INFLATION
The top three commodity groups contributing to the province’s food inflation for the bottom 30% income households during the month were the following:
Milk, other dairy products and eggs with 1.47 percentage points;
Fruits and nuts with 1.14 percentage points; and
Meat and other parts of slaughtered land animals with 0.46 percentage points.
The remaining food groups contributed -2.77 percentage points. (Table C)
Table C. Year-on-Year Food Inflation Rates and Contribution to the Trend of the
Food Inflation and to the Food Inflation in Misamis Oriental for the
Bottom 30% Income Households by Food Group
(2018=100)
| COMMODITY GROUP | FOOD INFLATION RATE (in %) | CONTRIBUTION | ||||
|---|---|---|---|---|---|---|
| MAR 2024 | FEB 2025 | MAR 2025 | TREND OF THE FOOD INFLATION (in %) | FOOD INFLATION | ||
| (in %) | (in percentage point) | |||||
| FOOD | 7.9 | 3.0 | 0.3 | 100.0 | 100.0 | 0.3 |
Cereals and Cereal Products | 20.3 | 3.3 | -1.8 | 73.1 | -274.3 | -0.82 |
| Cereals | 23.0 | 3.3 | -2.7 | |||
| Rice | 30.1 | 2.6 | -2.9 | |||
| Corn | 4.3 | 5.7 | -1.8 | |||
| Flour, Bread and Other Bakery Products, Pasta Products, and Other Cereals | 2.9 | 3.3 | 4.5 | |||
Meat and Other Parts of Slaughtered Land Animals | 0.5 | 2.0 | 3.0 | 0.0 | 153.4 | 0.46 |
Fish and Other Seafood | 0.3 | -6.5 | -10.1 | 15.4 | -657.7 | -1.97 |
| Milk, Other Dairy Products, and Eggs | 5.9 | 15.0 | 16.2 | 0.0 | 489.8 | 1.47 |
| Oils and Fats | 2.1 | -2.5 | -1.9 | 0.0 | -0.8 | 0.00 |
| Fruits and Nuts | 20.8 | 34.1 | 30.9 | 2.5 | 381.5 | 1.14 |
| Vegetables, Tubers, Cooking Bananas and Pulses | -11.9 | 3.4 | 0.1 | 7.2 | 1.9 | 0.01 |
| Sugar, Confectionery and Desserts | -4.6 | 0.1 | 4.6 | 0.0 | 33.4 | 0.10 |
| Ready-Made Food and Other Food Products N.E.C. | 4.6 | -0.3 | -1.5 | 2.9 | -3.53 | -0.06 |
| Source: Philippine Statistics Authority, Retail Price Survey of Commodities for the Generation of Consumer Price Index Note: Details may not add up due to rounding. | ||||||
Notes:
The CPI for the bottom 30% income households is compiled to measure the changes in prices of commodities commonly purchased by the families that belong to the bottom 30% income decile. Price collection and CPI computation follow the same procedure as for all-income households. However, there is a separate market basket and weights for the CPI for the bottom 30% income households.
CPIs and inflation rates by province and selected city are posted at the PSA OpenSTAT portal at https://openstat.psa.gov.ph/database.
(SGD.)MARIA LIZA M. BIGORNIA
(Chief Statistical Specialist)
Officer-In-Charge
MLG