

Release Date :
Reference Number :
PSA43-SR-2024-001
Table A. Year-on-Year Headline Inflation Rates, All Items in Percent:
January 2023 and December 2023 to January 2024
(2018=100)
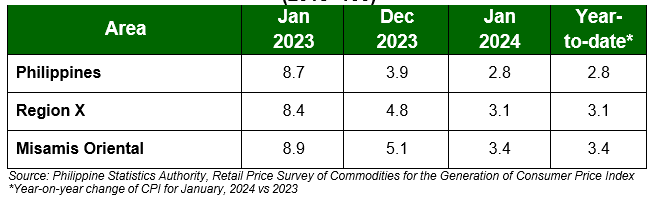
The Province of Misamis Oriental recorded a headline inflation rate of 3.4 percent in January 2024. This is higher than the regional and national rates of 3.1 percent and 2.8 percent, respectively. Similar to the regional and national trends, the province’s headline inflation rate decelerated since January 2023.
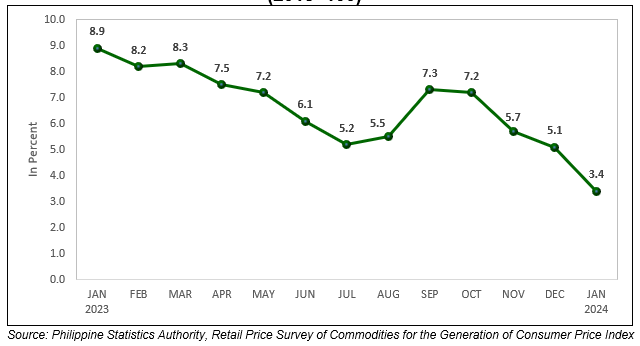
Figure 1. Headline Inflation Rates in Misamis Oriental, All Items:
January 2023 to January 2024
(2018=100)
Headline Inflation
The headline inflation in Misamis Oriental slowed down further in January 2024, the lowest over the year-long trend. Subsequent decrease was recorded from March 2023 at 8.3 percent down to July 2023 at 5.2 percent. The same movement was observed from September 2023 at 7.3 percent down to the current headline inflation rate. (Figure 1)
Main Drivers to the Downward Trend of the Headline Inflation
The downtrend in overall inflation in January 2024 was primarily brought about by the lower year-on-year growth in the index of food and non-alcoholic beverages at 6.7 percent in January 2024 from 9.6 percent in the previous month. Followed by the index of housing, water, electricity, gas and other fuels with -0.4 percent inflation during the month from 0.9 percent in December 2023. Personal care, and miscellaneous goods and services also followed with 3.6 percent in January 2024 from 6.0 percent of the prior month.
Other indices contributed to the trend are the following commodity groups during the month:
a. Clothing and footwear, 1.8 percent from 3.6 percent;
b. Furnishings, household equipment and routine household maintenance, 0.9 percent from 2.6 percent;
c. Health, 0.1 percent from 1.0 percent;
d. Restaurants and accommodation services, 2.3 percent from 2.5 percent;
e. Transport, 0.0 percent from 0.2 percent; and
f. Financial Services, -0.1 percent from 0.0 percent.
On the contrary, the index of alcoholic beverages and tobacco exhibited an annual increase of 7.3 percent during the month from 4.6 percent in December 2023. Same was observed in the index of recreation, sport and culture at 1.7 percent during the month from 0.9 percent in the previous month.
The indices of the rest of the commodity groups retained their respective previous month’s annual rates. (Tables B)
Table B. Inflation Rates by Commodity Group in Misamis Oriental,
in Percent: January 2023 and December 2023 to January 2024
(2018 = 100)
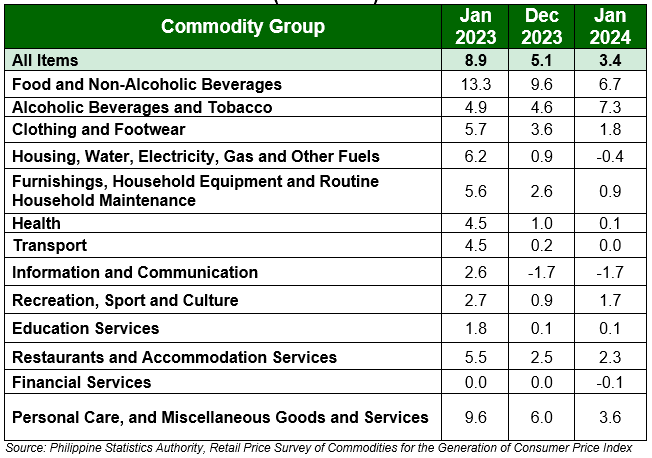
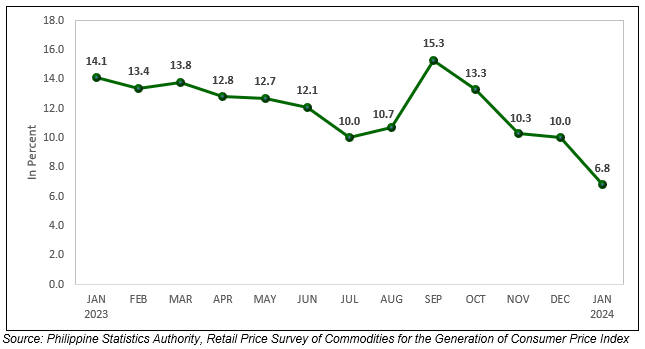
Figure 2. Food Inflation Rates in Misamis Oriental:
January 2023 to January 2024
(2018=100)
Food Inflation
Food inflation in Misamis Oriental eased at 6.8 percent in January 2024 from 10.0 percent in the previous month. In January 2023, food inflation was higher at 14.1 percent. (Figure 2)
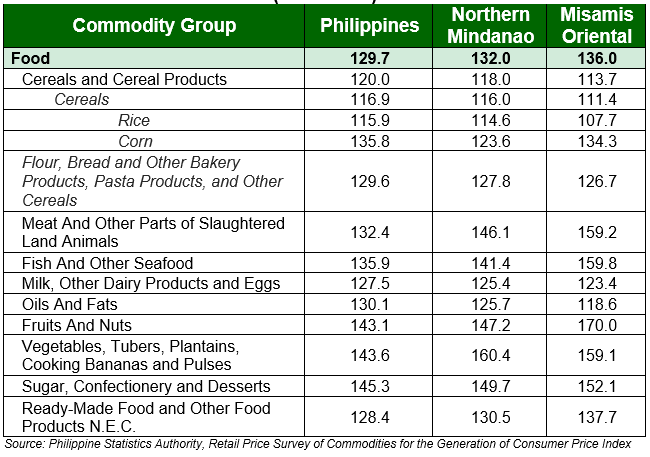
Consumer Price Index (CPI) of Food in the province was recorded at 136.0 during the month, which is higher than the regional and national levels at 132.0 and 129.7, respectively (Table C). On average, prices have increased by 36.0 percent since the base year of 2018, when the CPI was at 100. The base year serves as a reference point for comparison to see how much prices have changed over time.
Main Drivers to the Downward Trend of Food Inflation
The deceleration of food inflation in January 2024 was mainly due to the deceleration of cereals and cereal products from 19.6 percent of the prior month to 15.8 percent this month. Also, a year-on-year decrease in vegetables, tubers, plantains, cooking bananas and pulses at 10.3 percent during the month from 2.4 percent annual decline in December 2023.
Meanwhile, rice inflation slowed down by 3.8 percent, having a CPI of 111.9 in December 2023 to 107.7 in January 2024.
On the other hand, corn inflation recorded a deceleration of 5.6 percent from December 2023 to the current month.
Main Contributors to the Food Inflation
Food inflation shared 81.1 percent or 2.76 percentage points to the overall inflation in January 2024. The food groups with the highest contribution to the food inflation during the month were the following:
a. Cereals and cereal products, which includes rice, corn, flour, bread and other bakery products, pasta products, and other cereals, with 78.5 percent share or 5.34 percentage points;
b. Fish and other seafood with 11.6 percent share or 0.79 percentage point; and
c. Meat and other parts of slaughtered land animals with 6.1 percent share or 0.41 percentage point.
Table C. Consumer Price Index by Food Commodities: January 2024
(2018 = 100)
(SGD)MARIA LIZA M. BIGORNIA
(Chief Statistical Specialist)
Officer-In-Charge
| Attachment | Size |
|---|---|
|
|
263.71 KB |