

Release Date :
Reference Number :
PSAX-SR-2025-07
In 2024, the economy of Northern Mindanao grew by 6.0 percent, outpacing the 5.2 percent expansion recorded in 2023.
The main contributor to this economic performance was Wholesale and retail trade; Repair of Motor Vehicles and Motorcycles, which added 1.9 percentage points to the overall growth. Other top drivers included:
Construction, contributing 0.9 percentage point,
Manufacturing, with 0.6 percentage point,
Financial and insurance activities, also at 0.4 percentage point, and
Electricity, steam, water, and waste management (ESWW), contributing 3 percentage point.
Combined, these five growth drivers contributed 4.1 percentage points, accounting for more than half of the region’s total growth in 2024. (Table 1)
The 2024 economic growth translated to an increase of PhP 59.33 billion in the Gross Regional Domestic Product (GRDP) of Northern Mindanao, pushing the total value to PhP 1.04 trillion. This marked the Region X's entry to the trillion-peso economy, alongside five other regions.
Industry leads regional growth
Among the three major industries, Industry recorded the fastest expansion at 7.5 percent, higher than the previous year’s growth of 3.8 percent. Among its sub-industries, Construction had the fastest growth with 11.5 percent. This was followed by Mining and quarrying and ESWW with 7.6 percent and 6.6 percent, respectively. (Table 1)
Services also showed strong performance with 7.4 percent growth. Within Services, the top-performing industries were Other services, which grew by 12.6 percent, Accommodation and food service activities, 11.6 percent; and Human health and social work activities, 11.4 percent. (Table 1)
Meanwhile, the Agriculture, Forestry, and Fishing (AFF) grew marginally by 0.1 percent. (Table 1)
Table 1. Gross Regional Domestic Product of Northern Mindanao, by Industry
Percent Share, Growth Rate and Contribution to Growth
At Constant 2018 Prices, In Percent and Percentage Point
Industry
| 2024 Percent Share to GRDP | 2023-2024 Growth Rate (in percent) | Contribution to 2024 Growth (in percentage point) | Industry Rank (in terms of con growth) | |
| Agriculture, forestry, and fishing | 17.9 | 0.1 | 0.01 | 16th | |
| Industry | 25.6 | 7.5 | 1.9 | ||
| 1 | Mining and quarrying | 0.3 | 7.6 | 0.02 | 15th |
| 2 | Manufacturing | 11.9 | 5.3 | 0.6 | 3rd |
| 3 | Electricity, steam, water, and waste management | 4.9 | 6.6 | 0.33 | 5th |
| 4 | Construction | 8.3 | 11.5 | 0.9 | 2nd |
| Services | 56.5 | 7.4 | 4.1 | ||
| 1 | Wholesale and retail trade; repair of motor vehicles and motorcycles | 27.6 | 6.8 | 1.9 | 1st |
| 2 | Transportation and storage | 3.2 | 9.9 | 0.30 | 6th |
| 3 | Accommodation and food service activities | 2.41 | 11.6 | 0.27 | 7th |
| 4 | Information and communication | 2.39 | 5.4 | 0.13 | 13th |
| 5 | Financial and insurance activities | 4.4 | 8.5 | 0.4 | 4th |
| 6 | Real estate and ownership of dwellings | 4.1 | 5.0 | 0.21 | 11th |
| 7 | Professional and business services | 2.2 | 10.6 | 0.22 | 10th |
| 8 | Public administration and defense; compulsory social activities | 3.4 | 6.3 | 0.226 | 8th |
| 9 | Education | 4.0 | 5.7 | 0.229 | 9th |
| 10 | Human health and social work activities | 1.7 | 11.4 | 0.18 | 12th |
| 11 | Other services | 1.0 | 12.6 | 0.1 | 14th |
| Gross Regional Domestic Product | 100.00 | 6.0 | 6.0 | ||
Note: Details may not add up due to rounding.
Source: Philippine Statistics Authority
Region X economy is services-based
In 2024, Northern Mindanao’s economy remained predominantly Services-based Services shared 56.5 percent to the region’s economy. This was followed by Industry, which accounted for 25.6 percent, and Agriculture, forestry, and fishing (AFF) with 17.9 percent. (Table 1)
Among the 16 industries, the three largest contributors to the regional economy were Wholesale and retail trade; repair of motor vehicles and Motorcycles, 27.6 percent; AFF, 17.9 percent, and Manufacturing, which contributed 11.95 percent to the total GRDP. (Table 1)
These figures highlighted the sustained importance of Trade and Agriculture to the regional economy, while also underlining the growing contribution of industrial activities such as Manufacturing.
Per capita GRDP of Region X increases
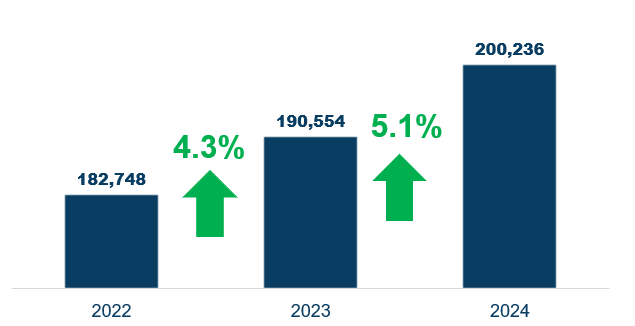
Northern Mindanao’s per capita gross regional domestic product (GRDP) was recorded at PhP 200,236 in 2024, which grew by 5.1 percent. This growth outpaced the previous year’s increase of 4.3 percent, indicating a stronger expansion of economic productivity relative to the region’s population size. The upward trend reflected the region’s improved economic performance and growing contribution to the national economy on a per-person basis. (Figure 1)
Figure 1. Per Capita GRDP: Northern Mindanao
At Constant 2018 Prices, In Percent
Source: Philippine Statistics Authority
Region X enters the trillion-peso club
Region X officially joined the ranks of the trillion-peso regional economies in 2024, solidifying its status as a key economic player in the country. With a GRDP of PhP 1.04 trillion, the region ranked as the sixth largest economy among 18 regions, accounting for 4.7 percent of the total Philippine Gross Domestic Product. (Table 2)
Table 2. Trillion-peso Economies as of 2024
Gross Regional Domestic Product at Constant 2018 Prices (in Thousand Pesos)
Share of Regional Economies at Constant 2018 Prices (in Percent)
| Region | 2024 GRDP | Percent Share | |
| 1 | National Capital Region | 6,941,893,740 | 31.2 |
| 2 | CALABARZON | 3,266,385,078 | 14.7 |
| 3 | Central Luzon | 2,467,916,743 | 11.1 |
| 4 | Central Visayas | 1,276,347,867 | 5.7 |
| 5 | Davao Region | 1,082,492,455 | 4.9 |
| 6 | Northern Mindanao | 1,043,493,796 | 4.7 |
Source: Philippine Statistics Authority
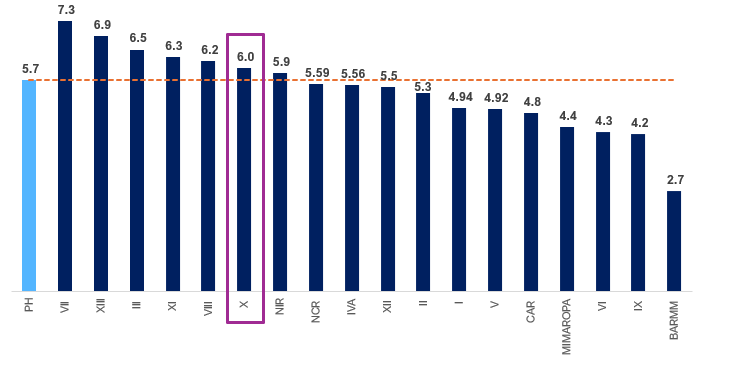
Figure 2. Gross Regional Domestic Product by Region
Growth Rate, 2023-2024
At Constant 2018 Prices, In Percent
Source: Philippine Statistics Authority
Region X is one of the seven regions outpacing the national GDP growth
Region X was one of the seven regions that recorded economic growth faster than the national GDP growth of 5.7 percent, achieving a 6.0 percent growth rate. This performance placed Region X as the sixth fastest growing regional economy in 2024, highlighting its continued rise as a major contributor to the country’s economic development. (Figure 2)
Region X contributes to national economic growth
Region X made a notable contribution to the national economy, adding 0.3 percentage point to the 5.7 percent GDP growth of the Philippines. The region was the sixth biggest contributor among 18 regions in 2024. (Table 3)
At the industry level, Region X ranked among the top regional contributors to growth in several key sectors (Table 3):
Fourth largest contributor to growth in Public administration and defense; compulsory social security, adding 0.22 percentage point to the industry’s 2 percent growth.
Fifth largest contributor to Manufacturing, contributing 0.17 percentage point to its 3.7 percent national growth.
Fifth largest contributor to Wholesale and retail trade; repair of motor vehicles and motorcycles, with a contribution of 0.5 percentage point to its 5.6 percent expansion.
Fifth largest contributor to Accommodation and food service activities, adding 0.65 percentage point to the industry’s 10.4 percent growth.
Fifth largest contributor to Education, contributing 0.26 percentage point to its 4.4 percent growth.
Per Capita GRDP: Region X among the top regional economies
In 2024, Region X recorded the third highest per capita GRDP among all regions with PhP 200,236 behind National Capital Region (NCR) and Cordillera Administrative Region (CAR). This highlighted the region’s strong economic value relative to its population. (Figure 3)
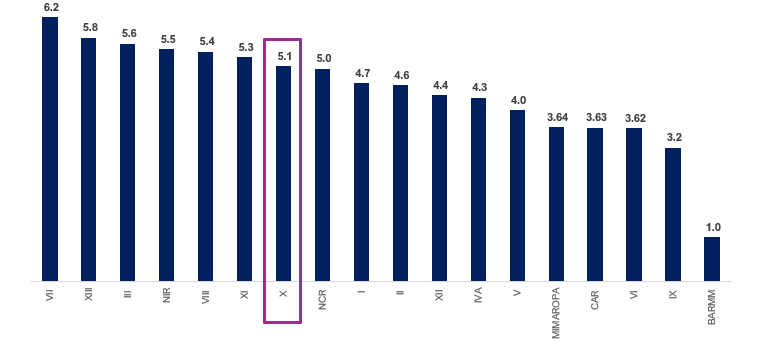
Meanwhile, Region X ranked seventh nationwide in terms of per capita GRDP growth rate. (Figure 4)
Table 3. Gross Domestic Product by Industry, Philippines and Region X
Percent Share, Growth Rate and Contribution to Growth
At Constant 2018 Prices, In Percent and Percentage Point
| Industry | Philippine 2024 Growth Rate (in percent) | Reg X 2024 Growth Rate (in percent) | Reg X 2024 Percent Share to Total Industry | Reg X Contribution to Growth of Industry (in percentage point) | Reg X Rank (in terms of con growth of industry) | |
| Agriculture, forestry, and fishing | -1.5 | 0.1 | 10.5 | 0.01 | 6th | |
| Industry | 5.6 | 7.5 | 4.1 | 0.305 | 6th | |
| 1 | Mining and quarrying | 1.2 | 7.6 | 2.2 | 0.16 | 8th |
| 2 | Manufacturing | 3.7 | 5.3 | 3.2 | 0.17 | 5th |
| 3 | Electricity, steam, water, and waste management | 7.3 | 6.6 | 7.03 | 0.468 | 7th |
| 4 | Construction | 10.2 | 11.5 | 5.2 | 0.60 | 6th |
| Services | 6.7 | 7.4 | 4.2 | 0.309 | 6th | |
| 1 | Wholesale and retail trade; repair of motor vehicles and motorcycles | 5.6 | 6.8 | 6.96 | 0.5 | 5th |
| 2 | Transportation and storage | 8.9 | 9.9 | 4.0 | 0.4 | 8th |
| 3 | Accommodation and food service activities | 10.4 | 11.6 | 5.6 | 0.65 | 5th |
| 4 | Information and communication | 4.5 | 5.4 | 3.3 | 0.1777 | 7th |
| 5 | Financial and insurance activities | 8.9 | 8.5 | 2.0 | 0.166 | 13th |
| 6 | Real estate and ownership of dwellings | 5.1 | 5.0 | 3.55 | 0.1780 | 7th |
| 7 | Professional and business services | 7.9 | 10.6 | 1.6 | 0.165 | 8th |
| 8 | Public administration and defense; compulsory social activities | 4.2 | 6.3 | 3.50 | 0.22 | 4th |
| 9 | Education | 4.4 | 5.7 | 4.7 | 0.26 | 5th |
| 10 | Human health and social work activities | 10.9 | 11.4 | 4.0 | 0.46 | 8th |
| 11 | Other services | 9.3 | 12.6 | 2.3 | 0.28 | 8th |
| GROSS DOMESTIC PRODUCT | 5.7 | 6.0 | 4.7 | 0.3 | 6th | |
Note: Details may not add up due to rounding.
Source: Philippine Statistics Authority
Figure 3. Per Capita GRDP by Region:2024
At Constant 2018 Prices, In Thousand Pesos
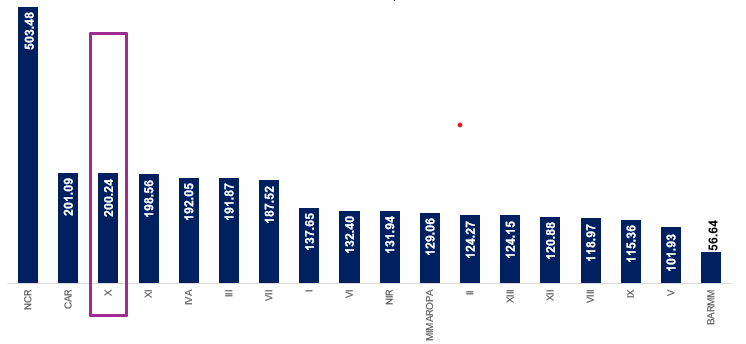
Figure 4. Per Capita GRDP Growth Rate by Region:2024
At Constant 2018 Prices, In Thousand Pesos
(SGD.)JANITH C. AVES, CE, DM
Regional Director
BMC
| Attachment | Size |
|---|---|
|
|
1.87 MB |
|
|
21.91 KB |