

In 2022, the provincial economy grew by 8.0 percent, faster than the recorded 4.7 percent growth in the previous year. This expansion resulted in a provincial Gross Domestic Product amounting to PhP 11.10 billion, exceeding the pre-pandemic GDP figure of PhP 11.08 billion. (Figure 1)
Figure 1. Gross Domestic Product of Camiguin: 2019 to 2022
Levels (in Billion PhP) and Growth Rates (in Percent)
at Constant 2018 Prices

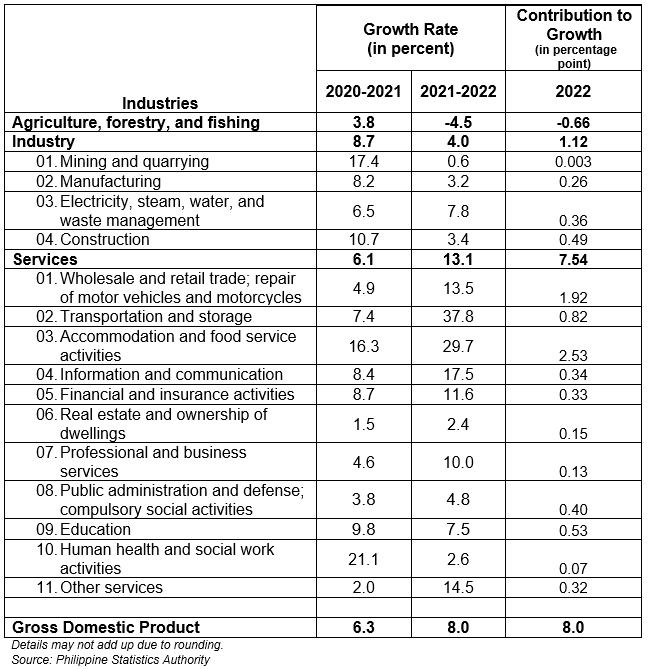
The accelerated economic growth of the province was attributed to the accelerated growth in Services at 13.1 percent compared to the recorded 3.4 percent growth in the previous year. Industry, on the other hand, slowed down its growth by 4.0 percent while Agriculture, Forestry, and Fishing posted a contraction of 4.5 percent. (Table 1)
Among the industries, the top contributors to the 8.0 economic growth were Accommodation and food service activities (2.5 percentage points), Wholesale and retail trade; repair of motor vehicles and motorcycles (1.9 percentage points), and Transportation and storage (0.8 percentage point). (Table 1)
Meanwhile, fastest growing industries were Transportation and storage which grew by 37.8 percent, Accommodation and food service activities with an increase of 29.7 percent, and Information and communication with 17.5 percent. (Table 1)
Table 1. Gross Domestic Product of Camiguin, by Industry
Growth Rate (in percent and Contribution to Growth (in percentage point)
At Constant 2018 Prices
Structure of the Economy
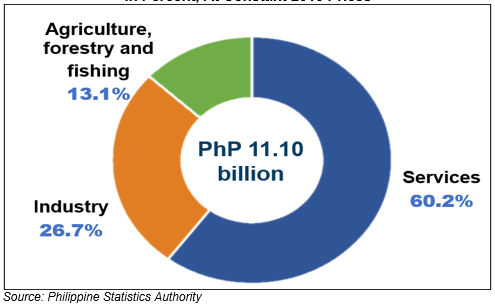
Camiguin's economic landscape is predominantly driven by Services, constituting 60.2 percent of the provincial economy. Industry sector followed accounting for 26.7 percent share, while Agriculture, forestry and fishing (AFF) shared 13.1 percent. (Figure 2)
Figure 2. Share of Major Industries to the Economy
of the Province of Camiguin: 2022
In Percent, At Constant 2018 Prices
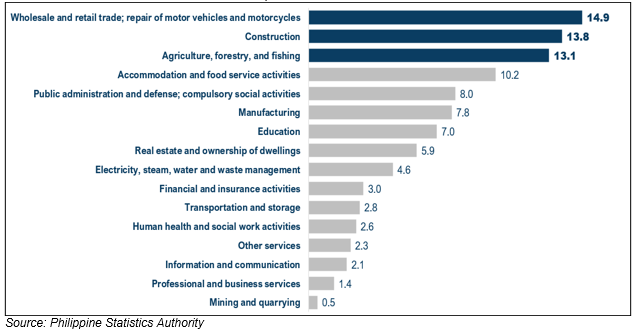
In terms of shares of the industries to the provincial economy, The three largest industries were Wholesale and retail trade sharing 14.9 percent, Construction with 13.8 percent share, and Agriculture, forestry and fishing accounting for 13.1 percent share to the province's economy. (Figure 3)
Figure 3. Share of Industries to the Economy of Camiguin: 2022
In Percent, At Constant 2018 Prices
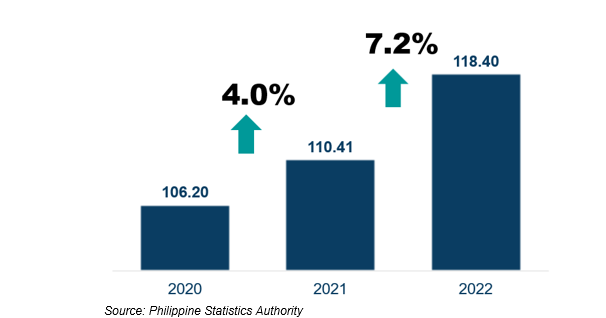
Per Capita GDP
The GDP value accounted by each person in the province is described by the per capita GDP. The province’s per capita GDP increased by 7.2 percent in 2022 translating to a value of PhP 118,402. This records an increase from the previous number of PhP 110,405 in 2021. (Figure 4)
Figure 4. Per Capita GDP: Province of Camiguin
In Percent, At Constant 2018 Prices
Camiguin vis-à-vis Other Economies in Northern Mindanao
Camiguin was one of the five economies in the region that posted faster economic growth than the regional economic growth of 7.2 percent. The province also recorded as the 3rd fastest growing economy in the region. (Figure 5)
Figure 5. Gross Domestic Product of Northern Mindanao, by Province/HUC
Growth Rate (in Percent), 2021 to 2022
at Constant 2018 Prices
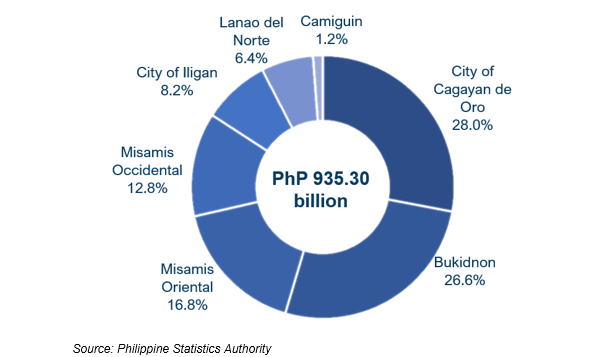
Moreover, the province accounted the least share of 1.2 percent to the Gross Regional Domestic Product (GRDP) of Region X. (Figure 6)
Figure 6. Share of Economies to the Gross Regional Domestic Product of
Northern Mindanao, by Province/HUC: 2022
Share (in Percent), at Constant 2018 Prices
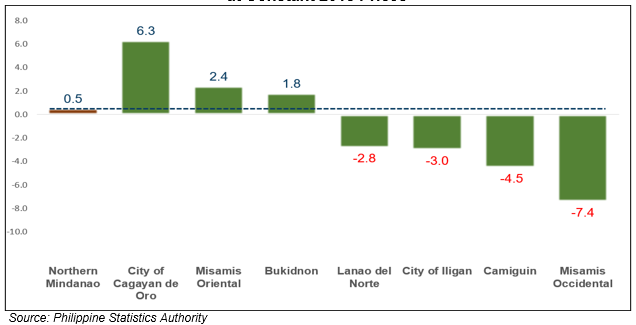
Comparing the economies of their performance in Agriculture, Forestry and Fishing (AFF), Camiguin was one of the 4 economies in the region which posted a decline. The province recorded a drop of 4.5 percent. (Figure 7)
Figure 7. Gross Value Added in Agriculture, Forestry, and Fishing of Northern
Mindanao, by Province/HUC
Growth Rate (in Percent), 2021 to 2022
at Constant 2018 Prices
In terms of share to AFF, Camiguin had 0.8 percent share to the region’s GDP. (Figure 8)
Figure 8. Share of Economies to 2022 Agriculture, Forestry, and Fishing
Of Northern Mindanao, by Province/HUC: 2022
Share (in Percent), at Constant 2018 Prices
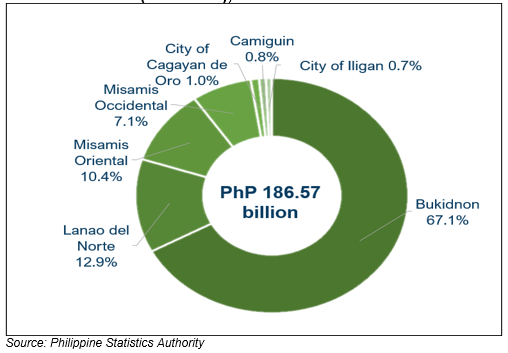
Figure 9. Gross Value Added in Industry of Northern Mindanao,
by Province/HUC
Growth Rate (in Percent), 2021 to 2022
at Constant 2018 Prices
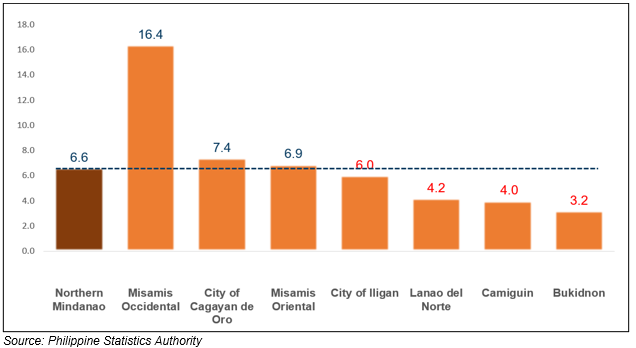
Looking at the performance of economies in Industry, Camiguin was one of the four economies which grew slower than the average regional growth of 6.6 percent. (Figure 9)
In terms of Industry share, the province had the least industry share of 1.2 percent. (Figure 10)
Figure 10. Share of Economies to 2022 Industry of Northern Mindanao,
by Province/HUC: 2022
Share (in Percent), at Constant 2018 Prices
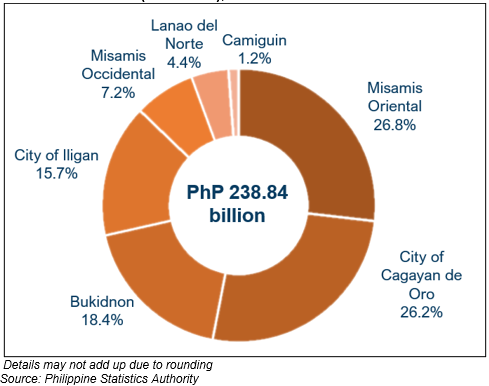
Figure 11. Gross Value Added in Services of Northern Mindanao,
by Province/HUC
Growth Rate (in Percent), 2021 to 2022
at Constant 2018 Prices

In Services, Camiguin registered the fastest growth among the 7 economies in the region. The province posted a 13.1 percent growth rate surpassing the regional growth of 10.1 percent. (Figure 11)
Figure 12. Share of Economies to 2022 Services of Northern Mindanao,
by Province/HUC: 2022
Share (in Percent), at Constant 2018 Prices

In terms of share to Services in Region X, Camiguin accounted for the least share of 1.3 percent in 2022. (Figure 12)
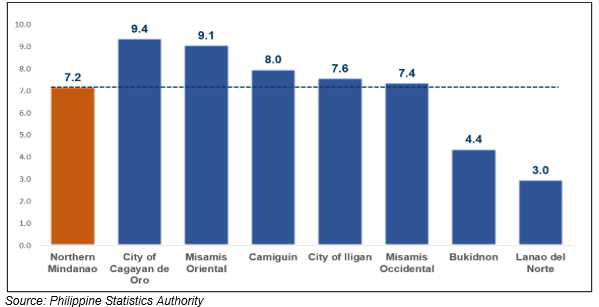
Figure 13. Per Capita GDP of the Economies in Region X: 2022
In Thousand Pesos, at Constant 2018 Prices

In terms of per capita GDP, Camiguin was one of the four economies which posted lower per capita GDP than the regional per capita GDP at 182.36 thousand pesos. (Figure 13)
In terms of per capita GDP growth rate, the province recorded the 3rd highest increase in per capita GDP which is also higher than the regional average increase of 6.0 percent, (Figure 14)
Figure 14. Per Capita GDP of the Economies in Region X
Growth Rate (in Percent), 2021 to 2022
At Constant 2018 Prices

The Provincial Product Accounts or PPA is a mechanism of the PSA to compile the annual estimates of Gross Domestic Product by province and highly urbanized cities, consistent with the National and Regional Accounts of the Philippines. In 2023, a PPA for 82 provinces and 17 highly urbanized cities is compiled for monitoring economic performance at the local level.
Full statistical tables and visuals can be accessed via the PSA website at https://psa.gov.ph/statistics/ppa and the PSA Camiguin Facebook Page at https://www.facebook.com/PSAcam.
(SGD.)FRANCISCO C. GALAGAR JR.
Chief Statistical Specialist
JNA