

Table A. Year-on-Year Headline Inflation Rates, All Items in Percent:
February 2023, and January to February 2024
(2018=100)
| Area | Feb 2023 | Jan 2024 | Feb 2024 | Year- to-date* |
| Philippines | 8.6 | 2.8 | 3.4 | 3.1 |
| Region X | 8.0 | 3.1 | 3.4 | 3.3 |
| City of Cagayan de Oro | 7.5 | 2.7 | 2.7 | 2.7 |
Source: Philippine Statistics Authority, Retail Price Survey of Commodities for the Generation of Consumer Price Index
*Year-on-year change of CPI for January to February, 2024 vs 2023
Headline Inflation
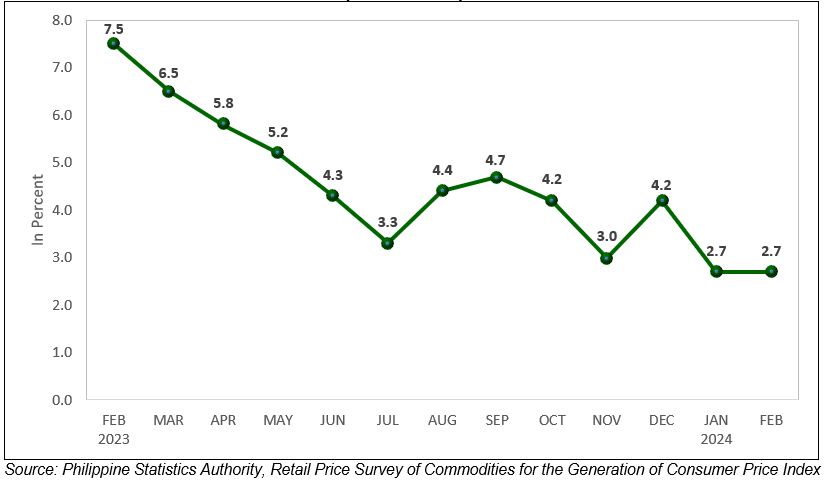
The inflation rate of the City of Cagayan de Oro registered 2.7 percent in February 2024, lower than the regional and national rate which were both at 3.4 percent. Also, it was slower than the 7.5 percent inflation rate in February 2023. (Table A)
The city maintained its inflation rate from January 2024 to February 2024. Furthermore, a downtrend was recorded from February 2023 to July 2023 with 3.3 percent at the end of the trend. The inflation increased to 4.7 percent in September 2023 and declined further in November 2023 at 3.0 percent. Clearly, the inflation rate in February 2024 was lower than the posted inflation rates of the past twelve months. (Figure 1)
Figure 1. Headline Inflation Rates in Cagayan de Oro City, All Items:
February 2023 to February 2024
(2018=100)
Trends of Commodity Groups
The commodity groups that upswing in the February 2024 inflation rate were:
- Alcoholic beverages and tobacco, 4.0 percent from 1.9 percent;
- Transport, -0.9 percent from -2.4 percent; and
- Restaurants and accommodation services, 0.7 percent from 0.2 percent.
In contrast, seven commodity groups posted lower inflation rates during the month:
- Food and non-alcoholic beverages, 7.5 percent from 8.2 percent;
- Housing, water, electricity, gas and other fuels, -0.2 percent from 3 percent;
- Furnishings, household equipment and routine household maintenance, 2.4 percent from 2.5 percent;
- Health, -2.2 percent from -2.1 percent;
- Information and communication, 0.1 percent from 0.2 percent;
- Recreation, sport and culture, -0.2 percent from -0.1 percent; and
- Personal care, and miscellaneous goods and services, 0.6 percent from 1.2 percent.
Clothing and footwear, education services, and financial services retained their inflation rates in January 2024. (Table B)
Main Contributors to the Headline Inflation
The top three commodity groups contributed 2.93 percentage points to the February 2024 overall inflation were: food and non-alcoholic beverages; alcoholic beverages and tobacco; and furnishings, household equipment and routine household maintenance. The remaining commodity groups contributed -0.23 percentage points to the overall inflation.
Table B. Inflation Rates by Commodity Group in Cagayan de Oro City,
in Percent: February 2023 and January 2024 to February 2024
(2018 = 100)
| Commodity Group | Feb 2023 | Jan 2024 | Feb 2024 |
| All Items | 7.5 | 2.7 | 2.7 |
| Food and Non-Alcoholic Beverages | 11.8 | 8.2 | 7.5 |
| Alcoholic Beverages and Tobacco | 4.2 | 1.9 | 4.0 |
| Clothing and Footwear | 3.3 | -2.8 | -2.8 |
| Housing, Water, Electricity, Gas and Other Fuels | 5.8 | 0.3 | -0.2 |
| Furnishings, Household Equipment and Routine Household Maintenance | 2.7 | 2.5 | 2.4 |
| Health | 1.4 | -2.1 | -2.2 |
| Transport | 6.9 | -2.4 | -0.9 |
| Information and Communication | 0.6 | 0.2 | 0.1 |
| Recreation, Sport and Culture | 1.6 | -0.1 | -0.2 |
| Education Services | 2.4 | -0.5 | -0.5 |
| Restaurants and Accommodation Services | 8.7 | 0.2 | 0.7 |
| Financial Services | 0.0 | 0.0 | 0.0 |
| Personal Care, and Miscellaneous Goods and Services | 6.4 | 1.2 | 0.6 |
Source: Philippine Statistics Authority, Retail Price Survey of Commodities for the Generation of Consumer Price Index
Food Inflation
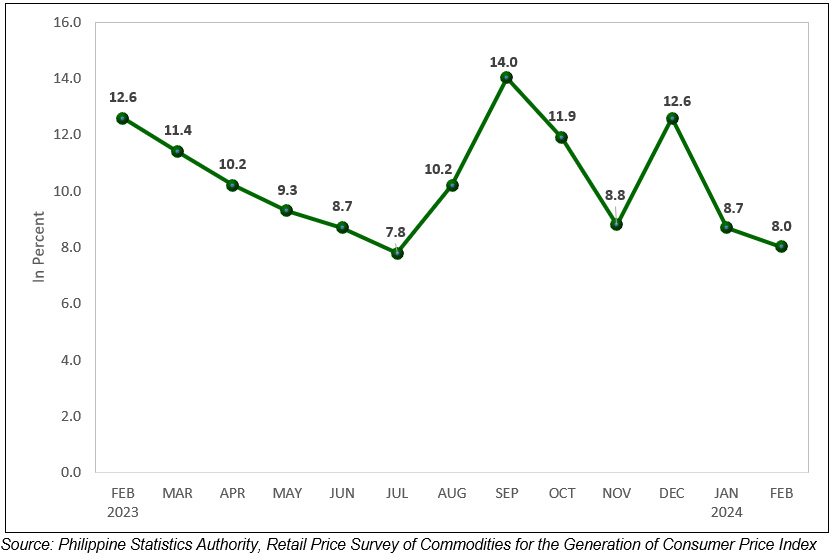
Food inflation in Cagayan de Oro City dropped to 8.0 percent in February 2024 from 8.7 percent in the previous month. In February 2023, food inflation was higher at 12.6 percent. (Figure 2)
As shown in Table C, the Consumer Price Index (CPI) of food in the city recorded 137.3 in February 2024, a higher CPI than in February 2023 and January 2024 at 127.1 and 136.4, respectively. On average, prices have increased by 37.3 percent since the base year of 2018, when the CPI was at 100. The base year serves as a reference point for comparison to see how much prices have changed over time.
Figure 2. Food Inflation Rates in Cagayan de Oro City:
February 2023 to February 2024
(2018=100)
Main Drivers to the Downward Trend of the Food Inflation
The deceleration of food inflation was led by the decline inflation rate of vegetables, tubers, plantains, cooking bananas and pulses to -8.3 percent in February 2024 from 1.7 percent in the preceding month.
Other food groups that contributed to the downtrend during the month were:
- Milk, other dairy products and eggs, 0.9 percent from 4.1 percent;
- Fish and other seafood, -2.7 percent from -1.1 percent;
- Fruits and nuts, 14.6 percent from 18.8 percent; and
- Sugar, confectionery and desserts, 1.2 percent from 1.9 percent.
In contrast, four food groups recorded faster inflation rates during the month:
- Cereals and cereal products, 27.6 percent from 24.8 percent;
- Meat and other parts of slaughtered land animals, 1.1 percent from -0.4 percent;
- Oils and fats, 2.9 percent from 1.0 percent; and
- Ready-made food and other food products n.e.c., 1.2 percent from -0.4 percent.
Moreover, rice inflation increased to 36.2 percent in February 2024 compared to the 32.2 percent in the previous month. Similarly, the corn inflation at 10.5 percent during the month was faster than the 9.9 percent inflation in January 2024. (Table C)
Main Contributors to the Food Inflation
The food groups with the highest contribution to the food inflation during the month were: cereals and cereal products; fruits and nuts; and fish, dried, salted, in brine or smoked. The said food groups contributed 8.6 percentage points to the overall food inflation. The rest of the commodities contributed -0.6 percentage points to the total food inflation.
Table C. Consumer Price Index, and Month-on-Month and Year-on-Year
Percent Changes by Food Group in Cagayan de Oro City
(2018 = 100)
| Commodity Group | Consumer Price Index (CPI) | Inflation Rates (in %) | |||
| Feb 2023 | Jan 2024 | Feb 2024 | Jan 2024 | Feb 2024 | |
| Food | 127.1 | 136.4 | 137.3 | 8.7 | 8.0 |
| Cereals and Cereal Products | 102.5 | 127.7 | 130.8 | 24.8 | 27.6 |
| Cereals | 97.6 | 128.3 | 132.0 | 31.3 | 35.1 |
| Rice | 96.8 | 128.1 | 131.8 | 32.2 | 36.2 |
| Corn | 123.3 | 136.8 | 136.3 | 9.9 | 10.5 |
| Flour, Bread and Other Bakery Products, Pasta Products, and Other Cereals | 123.8 | 125.0 | 125.6 | 1.7 | 1.4 |
| Meat And Other Parts of Slaughtered Land Animals | 137.1 | 137.4 | 138.6 | -0.4 | 1.1 |
| Fish And Other Seafood | 157.2 | 150.6 | 152.9 | -1.1 | -2.7 |
| Milk, Other Dairy Products and Eggs | 118.3 | 120.9 | 119.4 | 4.1 | 0.9 |
| Oils And Fats | 112.9 | 114.0 | 116.2 | 1.0 | 2.9 |
| Fruits And Nuts | 145.3 | 170.7 | 166.5 | 18.8 | 14.6 |
| Vegetables, Tubers, Plantains, Cooking Bananas and Pulses | 174.4 | 169.0 | 159.9 | 1.7 | -8.3 |
| Sugar, Confectionery and Desserts | 128.8 | 130.7 | 130.4 | 1.9 | 1.2 |
| Ready-Made Food and Other Food Products N.E.C. | 123.2 | 122.3 | 124.7 | -0.4 | 1.2 |
Source: Philippine Statistics Authority, Retail Price Survey of Commodities for the Generation of Consumer Price Index
Note: CPIs and inflation rates by province and selected city are posted at the PSA OpenSTAT portal accessible at https://www.psa.gov.ph
(SGD.)MARIA LIZA M. BIGORNIA
(Chief Statistical Specialist)
Officer-In-Charge