

The Customer Satisfaction Survey (CSS) is a quarterly undertaking of the Philippine Statistics Authority - Regional Statistical Services Office 10 to better understand the needs of the clients and meet or even surpass their expectations. For the Second Quarter of 2020, the CSS was conducted on June 17 and 19, 2020. A structured questionnaire was administered to one hundred fifty (150) randomly selected walk-in clients who transacted at the Civil Registration Service (CRS) Outlet in Cagayan de Oro City either by face-to-face interview or self-administration.
Historical data of actual head counts of client coming into the outlet in the previous month has provided an insight of what the actual population will be during the conduct of the survey. Additionally, the sampling also considers the limited number of clients to be catered in the outlet as a control measure being implemented during this time of pandemic. Systematic random sampling was the sampling method used in this survey. It is a type of probability sampling method in which sample members from a population are selected according to a random starting point but with a fixed interval (the sampling interval). Queue ticket numbers (QTNs) was the sampling variable used in determining the samples to be interviewed.
The main objective of the survey is to determine the satisfaction rating of the clients with the services provided by the PSA Serbilis Outlet and to determine factors affecting client’s satisfaction or dissatisfaction so that appropriate action/s can be done to address client’s dissatisfaction. Comments and suggestions of the clients will be a valuable basis for further improvements in the future, hence, these are also tabulated and presented in the last section of this analysis.
Demographic Profile of Respondents
The respondents were profiled using the demographic characteristics asked in the survey which includes the following; sex, place of origin, age and education (see Table 1). As shown on Table 1, majority of the respondents were female clients which constitutes 54.67%. It is a common observation that there are more female clients than male clients transacting in the outlet except in March 2020 when it was totally a different scenario from all the quarters when CSS were conducted. Noticeably, there are more male clients during that period.
In terms of the age of the respondents, the age group which recorded the highest number are from ages 20-24 (20.0%) followed by age groups 25-29 (16.0%) and age groups 30-34 (12.67%). The age groups 35-39 and 40-44 both accounted for the same percentage at 11.33% of the total sample.
Table 1. Demographic Profile of the Respondents
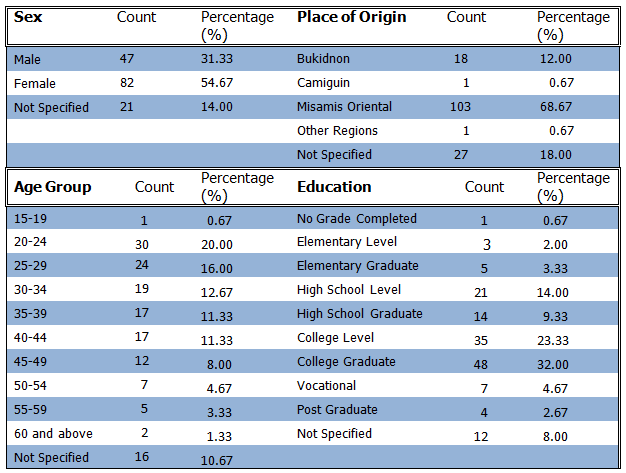
With respect to the educational attainment of the respondents, more than half or 55.33% of the total samples have acquired a college degree or have completed year/s in college. Furthermore, respondents who have graduated or have completed year/s in the high school level constitutes about 23.33% of the total samples. The educational attainment of the clients was included in the demographics to know the levels of education acquired by the clients as this is an important factor that affects their views towards the services of the PSA-Serbilis Outlet.
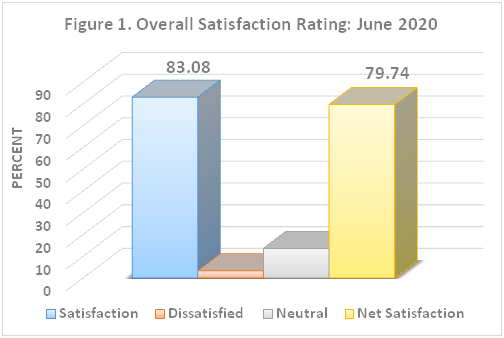
Figure 1 above shows the overall satisfaction rating by the public obtained from the June 2020 CSS. Results showed that satisfaction rating and net satisfaction rating were at 83.08% and 79.74%, respectively. These ratings were slightly higher compared to the minimum target satisfaction rating of 77% set by the office.
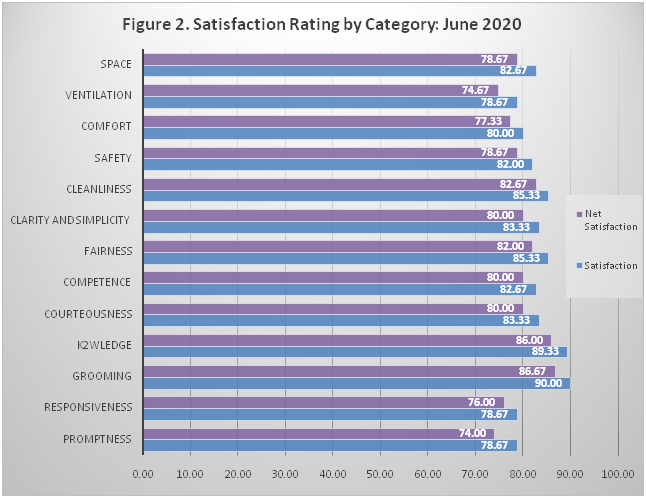
Satisfaction and net satisfaction ratings for each category assessed in the survey are presented in Figure 2. It can be noted that the satisfaction levels for each category were lower this quarter as compared to the previous quarters. The outlet’s ventilation, the employee’s promptness and responsiveness all got a satisfaction rating of 78.67%, below the 80.0% markings. The too cold air-conditioning units which drawn verbal complaints from the clients may have negatively impacted the satisfaction rating on this area. However, the office has instructed the guards and other personnel of the outlet to regulate the temperature and ensure that it is adjusted from time to time to ensure that the clients are comfortable. On the other hand, the low satisfaction rating of the employee’s promptness and responsiveness will be discussed with the concessionaire of the PSA, the Unisys Managed Services Corporation so that appropriate action may be taken to improve the satisfaction ratings on these areas.
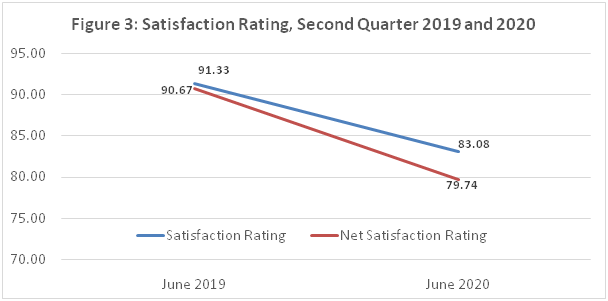
Moreover, the comparison of satisfaction ratings for the two time periods June 2019 and 2020 are shown in Figure 3. The line graph shows a decreasing trend in the satisfaction rating based on the results of the survey for the two periods.Consequently, the net satisfaction ratings decreased. The 8.25 percentage pointslump in the satisfaction rating from the year 2019 to the year 2020 could be attributed to areas determined above (ventilation, the employee’s promptness and responsiveness) including comfortability and safety of the outlet. These are the areas that need to be checked as well as other areas which were rated low by the public to come up with strategies on how to improve in the future.
The survey also gathers information on the client’s awareness on the various policy-adhering posters/materials posted in the outlet and establishment of express lanes and help desks to determine the office’s adherence to existing laws and regulations imposed for government offices.
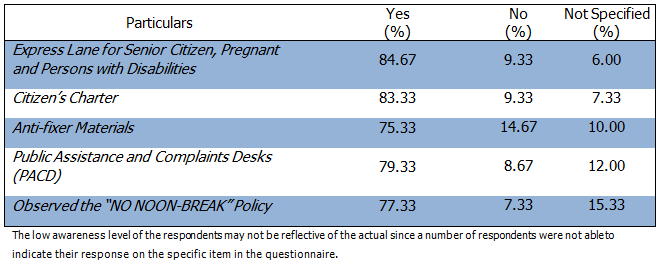
Table 2 tabulates the respondent’s awareness on various policy-adhering posters and materials posted in the outlet premise as well as mandatory establishment of Citizen’s Charter, Express Lane for Senior Citizens, Pregnant Women and Persons with Disabilities and Public Assistance and Complaints Desks (PACD) expressed in percentage. As presented in Table 2, more than 80.0% of the respondents are aware of the existence of “Express Lane for Senior Citizens, Pregnant Women and Persons with Disabilities” and the office’s compliance and implementation of Republic Act No. 9994 otherwise known as the “Expanded Senior Citizens Act” and Batas Pambansa Bilang 334 otherwise known as the “Accessibility Law”. Similarly, the same number of respondents reported to have noticed and/or read the citizen’s charter posted at the entrance of the outlet which clearly presents the step-by-step process in availing the various services offered by the Civil Registry Service Outlet.
On the other hand, Anti-fixer and No Noon-Break Policy materials and establishment of Public Assistance and Complaints Desks (PACD)all obtained less than 80.0% awareness among the respondents. The result may suggest problem on visibility due to its location and/or the materials might be too small to be noticed. Moreover, the non-response of the respondents on these specific items in the questionnaire have implications on the result.
Table 2. Respondents/Clients’ Awareness on Various Policy-Adhering Posters and Materials
(SGD) RUBEN D. ABARO, JR., CESE
Regional Director
For further inquiries, you may contact:
Civil Registration and Administrative Support Division
Philippine Statistics Authority Regional Statistical Service Office 10
1stFloor, Bldg. 4, Pride Rock Business Park
Gusa Highway, Cagayan de Oro City
Email: psaregion10@gmail.com
Telefax: (088) 856-2679