

Total number of establishments up by 104.1 percent
In 2018, Northern Mindanao’s total number of establishments in the formal sector of the economy was estimated at 16,575, more than twice the number in 2012, or equivalently, 104.1 percent. This can be translated to an average increase of 1,409 establishments per year. (Table A)
Among the broad industry group, Services dominated the economy with 14,936 establishments, accounting for 90.1 percent of the total. (Figure 1)
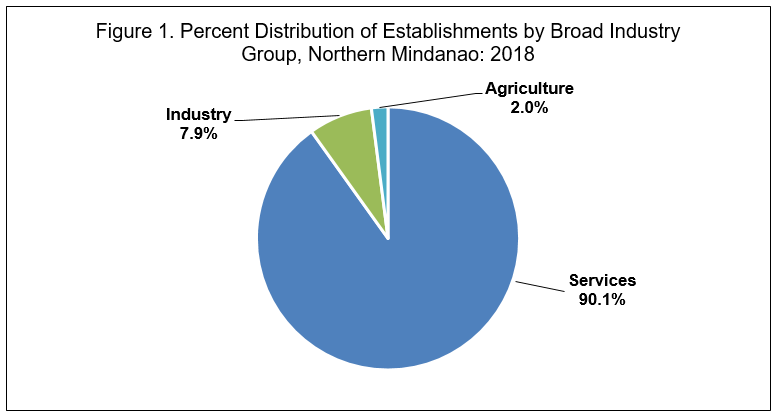
Among the 18 sectors, Wholesale and Retail Trade, Repair of Motor Vehicles and Motorcycles had the biggest share with 8,063 establishments or 48.6 percent of the total.
Total employment increases by 40.8 percent
Total employment grew by 40.8 percent, from 157,876 in 2012 to 222,345 in 2018. (Table A)
Majority (75.0%) of the workers were engaged in Services. (Figure 2)
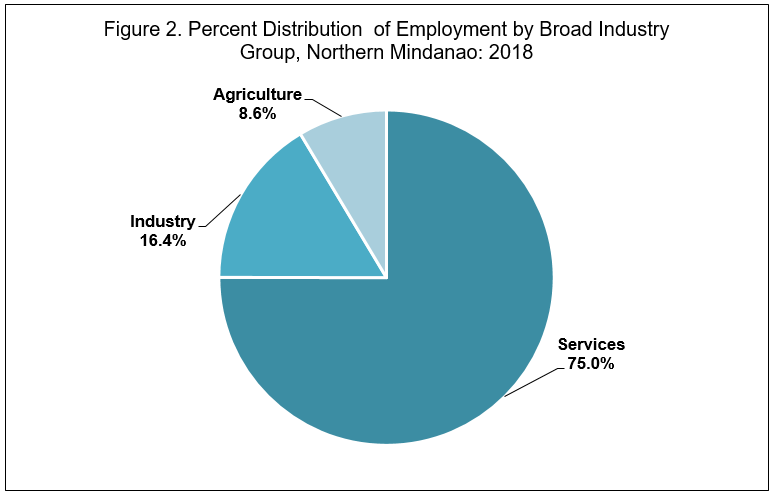
Wholesale and Retail Trade, Repair of Motor Vehicles and Motorcycles recorded the biggest share in total employment with 67,141 workers or 30.2 percent of the total.
Workers on Sub-Contract Agreement at 13.1 percent
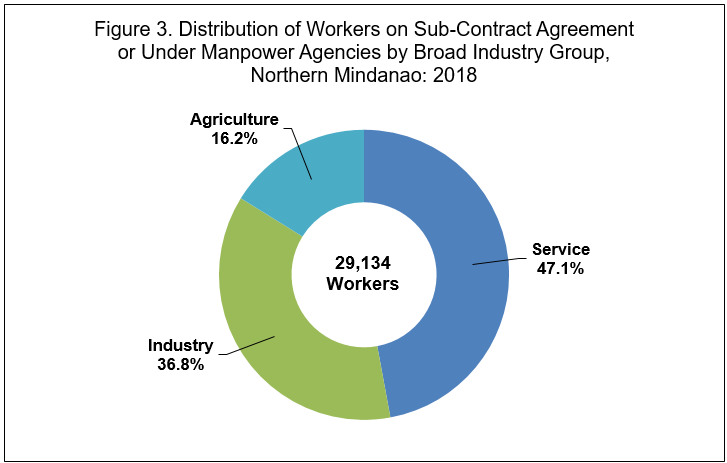
A total of 29,134 workers or 13.1 percent of the total employment in the formal sector were on sub-contract agreement or under manpower agencies. Services group posted the highest number of workers on sub-contract agreement, accounting for 47.1 percent of the total. (Figure 3)
Services accounts for the biggest share in revenue
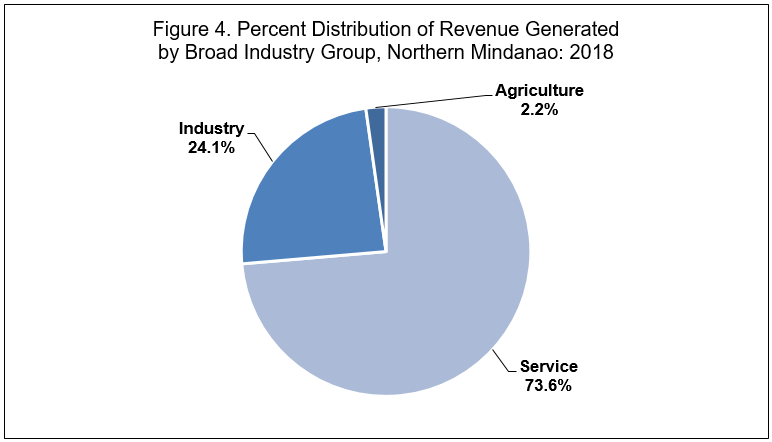
In 2018, the total revenue generated by establishments in the formal sector totaled PhP 917.3 billion, an increase of 182.5 percent from PhP 324.7 billion in 2012. Services contributed the biggest revenue share of PhP 675.5 billion or 73.6 percent of the total. (Figure 4)
Among the 18 sectors, Wholesale and Retail Trade, Repair of Motor Vehicles and Motorcycles was the top revenue generator, accounting for 57.3 percent of the total.
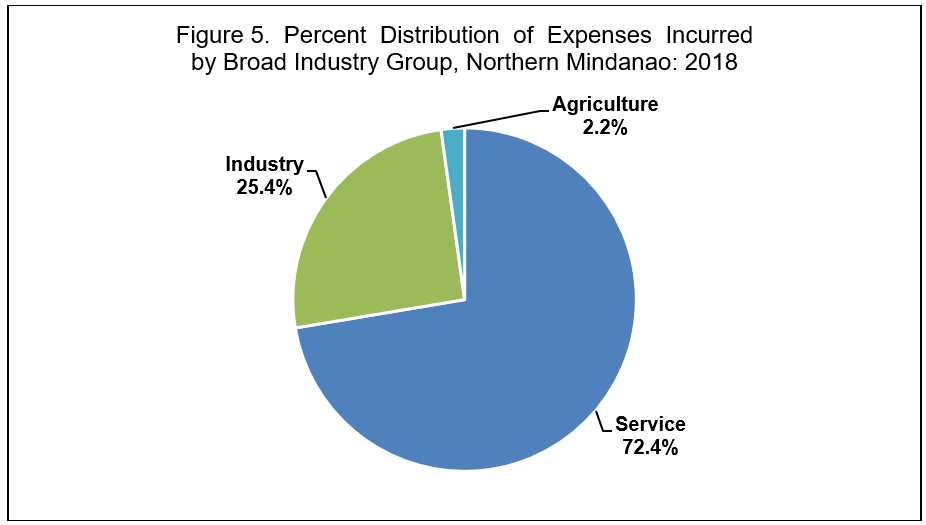
On the other hand, the total expense incurred in 2018 amounted to PhP 757.2 billion, a 159.2 percent growth from 2012. Services (PhP 548.0 billion) expended the most, accounting for 72.4 percent of the total. Wholesale and Retail Trade, Repair of Motor Vehicles and Motorcycles (PhP 430.2 billion or 56.8%) was the top spender among the 18 sectors. (Figure 5)
Sales from e-commerce transactions decline
Total sales from e-commerce transactions in 2018 were estimated at PhP 118.4 million, a decrease of 23.7 percent from PhP 155.2 million in 2012. Accommodation and Food Service Activities was the only sector with reported e-commerce sales in 2018.
JANITH C. AVES
(Chief Statistical Specialist)
Officer-in-Charge
For further inquiries, you may contact:
Statistical Operations and Coordination Division
Philippine Statistics Authority – Regional Statistical Services Office 10
3F, Limketkai Module-2 BPO & Cyberpark Building,
Rosario Crescent, Brgy. 31, Cagayan de Oro City
Email: psaregion10@gmail.com
Website: http://rsso10.psa.gov.ph
TECNICAL NOTES
The 2018 CPBI was conducted using a sample size of 60,683 establishments out of the total sampling frame units of 334,522 establishments which were engaged in economic activities classified under the 18 industry sections, that is, sections A to S, except section O or Public Administration and Defense; Compulsory Social Security, as defined in the 2009 Philippine Standard Industry Classification (PSIC).
The 2018 CPBI was conducted in May to September 2019. The reference period of all information gathered is year 2018, except for total employment which took a snapshot of the establishment’s number of employees as of 15 November 2018.
The 2018 CPBI is confined to the formal sector of the economy. The formal sector is comprised of the following:
1. Corporations and partnerships
2. Cooperatives and foundations
3. Single proprietorship with employment of 10 and over
4. Single proprietorship with branches
Sampling Unit
The sampling unit and the unit of enumeration in the 2018 CPBI is the establishment in the formal sector of the economy, which is defined as an economic unit which engages, under a single ownership or control, i.e. under a single legal entity, in one or predominantly one kind of economic activity at a single fixed physical location.
Thus, shops, factories, mining companies, electric plants, transport companies, radio stations, hotels, restaurants, banks, insurance companies, real estate development companies and the like are considered establishments in the formal sector provided that these are within the scope and coverage of the CPBI.
Ambulant peddlers and hawkers and movable stalls either along a public road or in a marketplace, as they do not have a fixed business location, are not considered as establishments. Similarly, open stalls in shopping centers, malls and markets are not to be included as they do not have permanency of business location.
Individual professionals and technical workers or craftsmen who do not maintain fixed offices or shops are also excluded.
Classification of Establishments
Establishments are classified according to its economic organization, legal organization, industrial classification, employment size, and geographic location.
- Economic Organization (EO) relates to the organizational structure or role of the establishment in the organization. An establishment may be classified as:
- Single establishment (EO=1) is an establishment which has neither branch nor main office. It may have ancillary unit/s other than main office located elsewhere;
- Branch (EO=2) is an establishment which has a separate main office located elsewhere;
- Establishment and main office (EO=3) is one which is both located at the same address and with branch/es elsewhere;
- Main office only (EO=4) is a unit which controls, supervises and directs one or more establishments of an enterprise; and,
- Ancillary unit other than main office (EO=5) is a unit that operates primarily or exclusively for a related establishment or group of related establishments or its parent establishment and provides services that support those establishments.
- Legal Organization (LO) refers to the legal form of the economic entity that owns the establishment. This provides the legal basis for ownership. Based on ownership, an establishment may have the following forms of legal organization.
- single proprietorship (LO=1);
- partnership (LO=2);
- government corporation (LO=3);
- stock corporation (LO=4);
- non-stock corporation (LO=5)
- cooperative (LO=6); and,
- other legal organizations such as foundations, associations, etc. (LO=7).
3. Industrial classification of an economic unit, in general, was determined by the activity from which it derives its major income or revenue. The 2009 PSIC was utilized to classify economic units according to their economic activities.
For example:
Bakery - C10711 (Baking of bread, cakes, pastries, pies, and similar “perishable” bakery products, including hopia and doughnut making)
Supermarket - G47112 (Retail selling in supermarkets)
Pawnshop - K64930 (Pawnshop operations)
4. The size of an establishment is determined by its total employment (TE). TE refers to the total number of persons who work in or for the establishment. This includes paid employees, working owners, unpaid workers and all employees who work full-time or part-time including seasonal workers. Also included are persons on short term leave such as those on sick, vacation or annual leaves and on strike. Excluded are workers of establishments who work under a subcontracting arrangement. Workers on a sub-contract agreement or under manpower agencies will be included in the report of the sub-contractors or the manpower agencies as part of their total employment.
5. The establishments are also classified by geographic are using the Philippine Standard Geographic Code (PSGC) classification. The geographic code of an establishment refers to the corresponding codes of the region, province, city/municipality and barangay where it is physically located.
Scope and Coverage
Only the business operations of establishments confined in the formal sector of the economy were covered in the 2018 CPBI.
Operationally, the formal sector includes:
- All establishments with total employment of 10 or more
- All establishments with total employment of less than 10, except those establishments that are under single proprietorship (LO=1) and are single establishments (EO=1) or those which has neither a branch nor a main office. It may have ancillary unit/s other than main office located elsewhere.
Thus, a single establishment (EO=1) with less than 10 employees, but owned or organized either as a partnership, corporation, cooperative or foundation is considered as part of the formal sector and thus is covered in the 2018 CPBI.
Likewise, an establishment owned by a single proprietor with less than 10 employees but with branch/es elsewhere and/or a main office elsewhere is also considered as part of the formal sector.
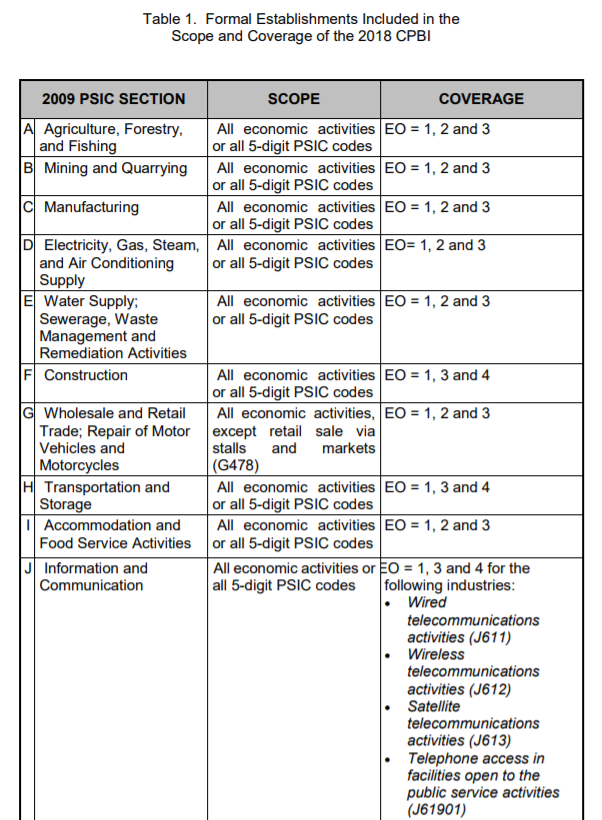
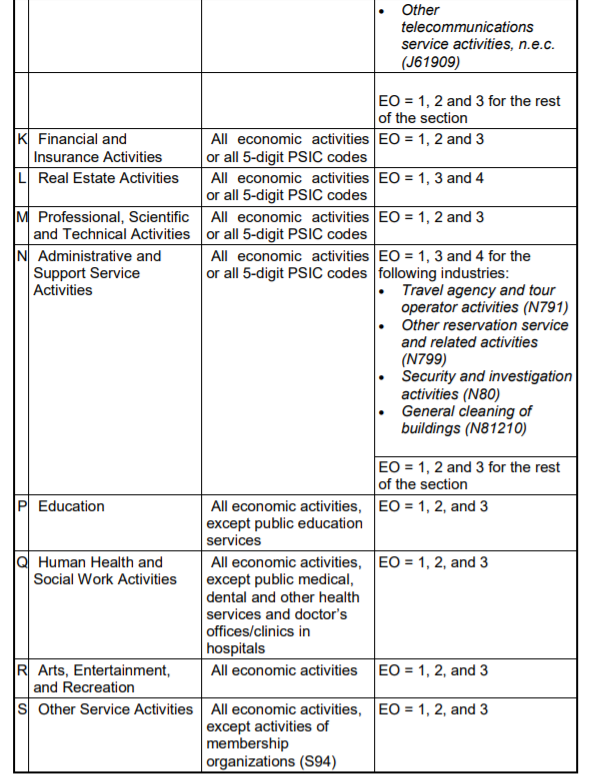
Specifically, the 2018 CPBI covered formal sector establishments which are engaged in the following economic activities, and with the corresponding types of economic organization (EO) as shown in Table 1.
Sampling Frame
The sampling frame for the 2018 CPBI was extracted from the 2018 List of Establishments (LE) as of 01 February 2019.
The 2018 LE is a result of the Comprehensive 2018 Updating of the List of Establishments (ULE) which involved a door-to-door canvassing, and inquiry on the basic characteristics of establishments using the Computer-Aided Personal Interview (CAPI) mode of data collection. The 2018 LE operation was conducted by PSA in May to October 2018 primarily to update the sampling frame for the 2018 CPBI.
A total of 999,070 establishments operating in the country are listed in the 2018 LE as of 1 February 2019, of which 334,522 (33.5%) comprised the 2018 CPBI frame which includes only those classified as part of the formal sector.
Sampling Design
All establishments with TE of 20 or more were taken on a 100 percent basis and comprised the certainty strata, while establishments with TE of less than 20 were taken on sampling basis and comprised the non-certainty strata of TE of one to nine, and TE of 10 to 19.
This means that all formal sector establishments with 20 or more employees were included as sample establishments.
For each region, the formal sector establishments with less than 20 employees were grouped according to the same 5-digit industry code and within the same TE size group, which are TE of one to nine, and TE of 10 to 19. For each group, called stratum, sample establishments were selected to represent the other establishments belonging to the same stratum.
Limitations of Data
The results of the 2018 CPBI are estimates representing the frame population covering establishments included in the formal sector category as listed in the PSA’s 2018 List of Establishments.
For confidentiality reasons, data rows with fewer than three contributing establishments are not presented in the tables. Additionally, establishment counts are suppressed. The data for these establishments, however, are still included in the computation of totals, averages or ratio.