

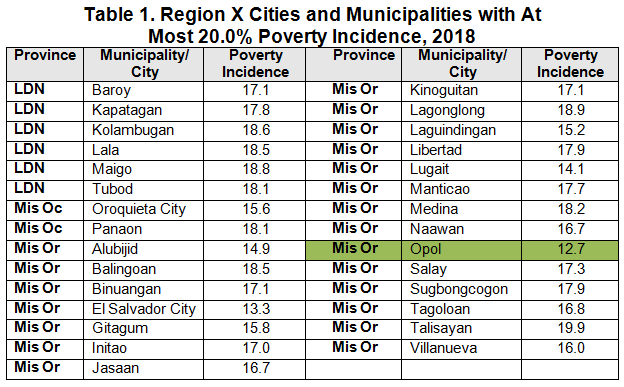
Municipality of Opol, Misamis Oriental recorded the lowest poverty incidence
In 2018, 31.9 percent of the 91 municipalities and component cities in the region were classified as Level 5, which refers to those with poverty incidences of at most 20.0 percent. This is equivalent to 29 municipalities and cities. Twenty-one of these cities and municipalities were from the province of Misamis Oriental. The municipality of Opol in Misamis Oriental recorded the lowest poverty incidence in the region. (Table 1)
Majority of the municipalities and cities were categorized as Level 4
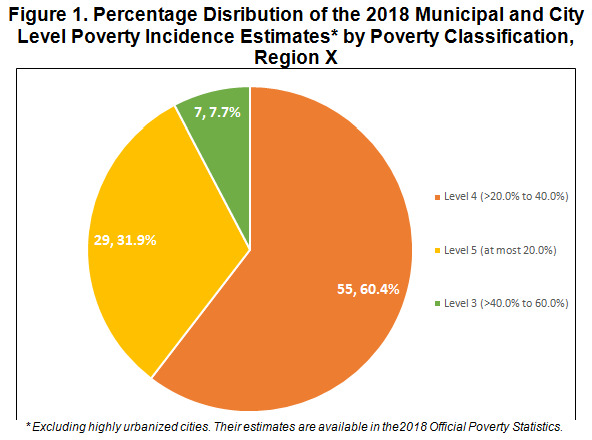
About 60.4 percent of the municipalities and component cities in the region were Level 4 or with poverty incidence more than 20.0 percent and up to 40.0 percent. For Level 3 or with poverty incidence more than 40.0 percent to 60.0 percent, about 7.7 percent of the municipalities and cities in the region belonged to this group. No city or municipality belonged to the extreme end of the distribution or in Level 1. (Figure 1)
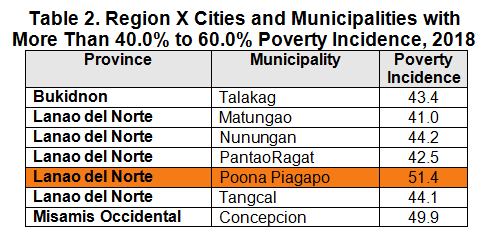
Majority of the Level 3 municipalities were in Lanao del Norte, Poona Piagapo posted highest poverty incidence
Most of the municipalities in Level 3 were from the province of Lanao del Norte with the municipality of Poona Piagapo recording the highest poverty incidence among the municipalities and component cities of Region X. (Table 2)
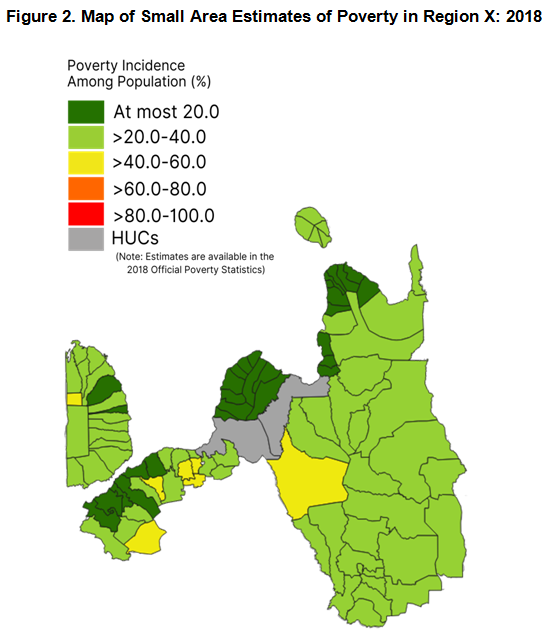
The poverty map in Figure 2 presents the poverty classification of the municipalities and cities in Region X wherein areas shaded in dark green refer to Level 5, light green for Level 4, yellow for Level 3, orange for Level 2, and red for Level 1.
It can be seen that majority of the municipalities and cities in Misamis Oriental were shaded dark green and a few were shaded light green. Meanwhile, in Bukidnon, most areas were shaded light green and only one was shaded yellow in Talakag. All areas in Camiguin were shaded light green. (Figure 2)
In the case of Lanao del Norte and Misamis Occidental, areas were shaded in three colors. Majority of these areas were shaded light green. However, five areas in Lanao del Norte were shaded yellow while one yellow area in Misamis Occidental. (Figure 2)
The release of the 2018 Municipal and City Level Poverty Estimates is a follow-up study to the earlier projects conducted by PSA (including those Small Area Estimation projects of the former National Statistical Coordination Board) which resulted to the release of 2000, 2003, 2006, 2009, 2012, and 2015 poverty estimates using the Small Area Estimation (SAE) technique developed by World Bank called the Elbers, Lanjouw, and Lanjouw (ELL) methodology.
The SAE methodology employed in the generation of the 2018 municipal and city level poverty estimates combined the 2015 Census of Population and the merged 2018 Family Income and Expenditure Survey and January 2019 round of the Labor Force Survey to produce reliable poverty estimates at lower levels of geographic disaggregation.
The 2018 SAE of Poverty produces estimates for the 14 sub-municipalities of the City of Manila, 110 cities, and 1,487 municipalities with corresponding standard errors, coefficients of variation, and confidence intervals. Full SAE table can be downloaded from https://psa.gov.ph/poverty-sae-press-releases/data.
FOR THE REGIONAL DIRECTOR:
(Sgd.)SARAH B. BALAGBIS
(Chief Statistical Specialist)
Officer-in-Charge