

Northern Mindanao
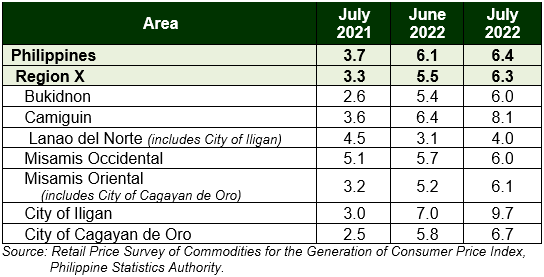
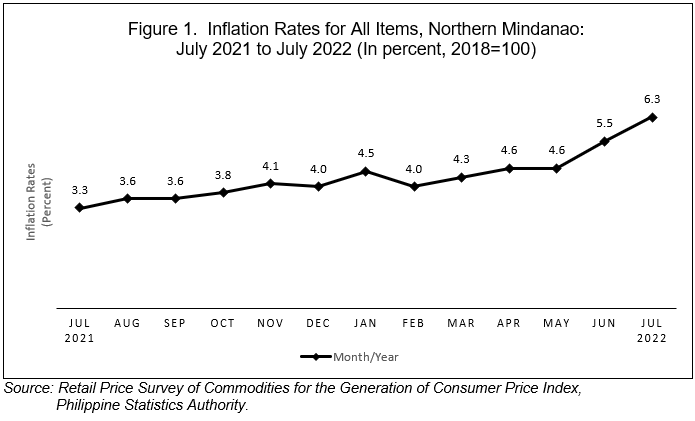
Regional inflation increased to 6.3 percent in July 2022, from 5.5 percent in the previous month. The inflation rate in July 2021 was lower at 3.3 percent. (Table A and Figure 1)
Table A. Year-on-Year Inflation Rates for All Items, Northern Mindanao:
July 2021, June 2022, and July 2022
(In percent, 2018=100)
By Commodity Group
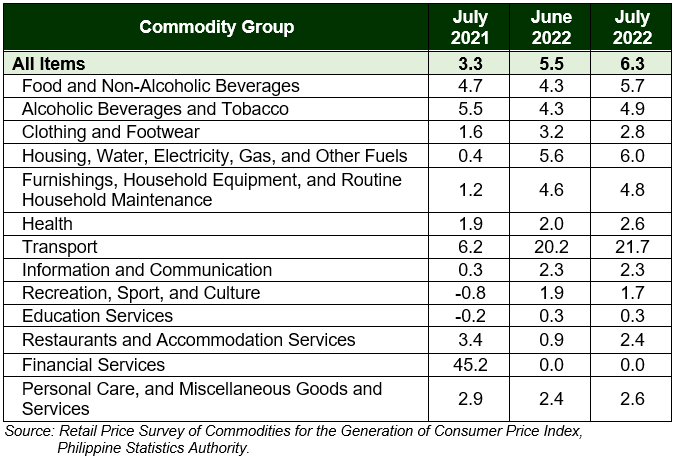
Month-on-month, inflation was higher in July 2022 in the following commodity groups: food and non-alcoholic beverages at 5.7 percent; alcoholic beverages and tobacco at 4.9 percent; housing, water, electricity, gas, and other fuels at 6.0 percent; furnishings, household equipment, and routine household maintenance at 4.8 percent; health at 2.6 percent; transport at 21.7 percent; restaurants and accommodation services at 2.4 percent; and personal care, and miscellaneous goods and services at 2.6 percent. (Table B)
On the other hand, slowdowns were observed in the inflation of the following commodity groups:
a. Clothing and footwear at 2.8 percent;
b. Recreation, sport, and culture at 1.7 percent.
The rest of the commodity groups had unchanged inflation rates.
Table B. Inflation Rate by Commodity Group for All Income Households,
Northern Mindanao: July 2021, June 2022, and July 2022
(In percent, 2018=100)
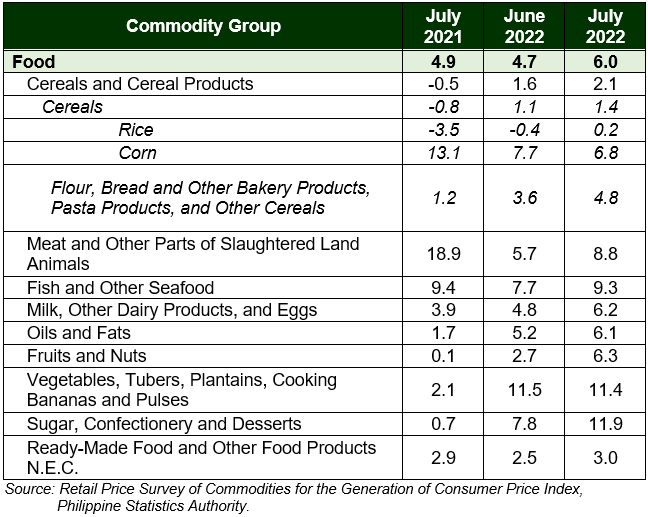
Food inflation accelerated to 6.0 percent, from 4.7 percent in the previous month.
In July 2021, food inflation was lower at 4.9 percent. (Table C)
Among food commodity groups, the inflation rates of the following sub-commodities in July 2022 increased compared to June 2022:
a. Cereals and Cereal Products, 2.1 percent;
b. Meat and other parts of slaughtered land animals, 8.8 percent;
c. Fish and other seafood, 9.3 percent;
d. Milk, other dairy products, and eggs, 6.2 percent;
e. Oils and fats, 6.1 percent;
f. Fruits and nuts, 6.3 percent;
g. Sugar, confectionery, and desserts, 11.9 percent;
h. Ready-made food and other food products n.e.c., 3.0 percent.
On the other hand, rice registered an inflation of 0.2 percent in July 2022 from a deflation of 0.4 percent in June 2022. Corn inflation slowed down to 6.8 percent from 7.7 percent in the preceding month. Further, inflation for flour, bread and other bakery products, pasta products, and other cereals accelerated to 4.8 percent in July 2022 from 3.6 percent in the previous month. The inflation for vegetables, tubers, plantains, cooking bananas, and pulses inched down to 11.4 percent from 11.5 percent in the previous month.
Table C. Inflation Rate of Food Items for All Income Households,
Northern Mindanao: July 2021, June 2022, and July 2022
(In percent, 2018=100)
Provinces and HUCs in Region X
All Items
All the provinces in the region posted higher inflation rates in July 2022 compared to June 2022: Bukidnon (6.0%), Camiguin (8.1%), Lanao del Norte (4.0%), Misamis Occidental (6.0%), and Misamis Oriental (6.1%). Camiguin posted the highest inflation rate in July 2022 among the five provinces. (Table A)
On the other hand, the City of Iligan (9.7%) and the City of Cagayan de Oro (6.7%) had higher inflation rates in July 2022 than the previous month.
Year-on-year, inflation in all provinces (except Lanao del Norte) and highly urbanized cities (HUCs) in the region accelerated in July 2022.
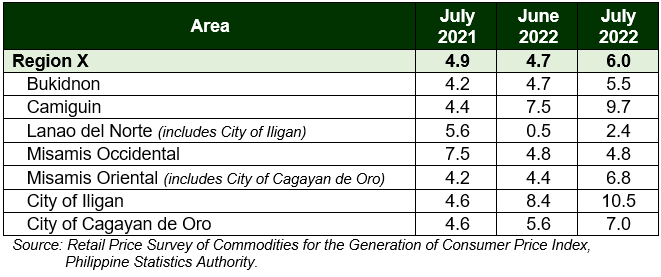
Food Items
Food inflation in the following provinces accelerated in July 2022 compared to the preceding month: Bukidnon (5.5%), Camiguin (9.7%), Lanao del Norte (2.4%), and Misamis Oriental (6.8%). The food inflation of Misamis Occidental (4.8%) is unchanged. (Table D)
Also, food inflation in the City of Iligan (10.5%) and the City of Cagayan de Oro (7.0%) accelerated in July 2022 compared to the previous month.
Year-on-year, the provinces of Bukidnon, Camiguin, Misamis Oriental, City of Cagayan de Oro, and City of Iligan posted higher food inflation rates in July 2022. The provinces of Lanao del Norte and Misamis Occidental registered lower food inflation rates in July 2022.
Table D. Inflation Rate of Food Items for All Income Households
by Province/HUC, Northern Mindanao: July 2021, June 2022, and July 2022
(In percent, 2018=100)
For the Regional Director:
(Sgd.) GEORGETTE F. GAYOMALI
Senior Statistical Specialist
TECHNICAL NOTES
Consumer Price Index (CPI) – The CPI is an indicator of the changes in the average retail prices of a fixed basket of goods and services commonly purchased by households relative to a base year.
Used of CPI – CPI is most widely used in the calculation of the inflation rate and purchasing power of peso. It is a major statistical series used for economic analysis and as a monitoring indicator of government economic policy.
Computation of CPI – The computation of the CPI involves consideration of the following important points:
a. Base Period – The reference data or base period is the benchmark or reference date or period at which the index is taken as equal to100.
b. Market Basket – A sample of the thousands of varieties of goods purchased for consumption and services availed by the households in the country selected to represent the composite price behavior of all goods and services purchased by consumers.
c. Weighing System – The weighing pattern uses the expenditures on various consumer items purchased by households as a proportion to total expenditure.
d. Formula – The formula used in computing the CPI is the weighted arithmetic mean of price relatives, the Laspeyre’s formula with a fixed base year period (2012) weights.
e. Geographic Coverage – CPI values are computed at the national, regional, and provincial levels, and for selected cities.
Inflation Rate (IR) – is the rate of change of the CPI expressed in percent. Inflation is interpreted in terms of declining purchasing power of peso.
Purchasing Power of Peso (PPP) – shows how much the peso in the base period is worth in the current period. It is computed as the reciprocal of the CPI for the period under review multiplied by 100.