

Release Date :
Reference Number :
PSA43-SR-2024-014
Table A. Year-on-Year Headline Inflation Rates, All Items in Percent:
July 2023, and June to July 2024 (2018=100)
| Area | Jul 2023 | Jun 2024 | Jul 2024 | Year- to-date* |
| Philippines | 4.7 | 3.7 | 4.4 | 3.7 |
| Region X | 4.0 | 5.0 | 5.7 | 4.3 |
| Cagayan de Oro City | 3.3 | 4.9 | 6.2 | 4.0 |
Source: Philippine Statistics Authority, Retail Price Survey of Commodities for the Generation of Consumer Price Index
*Year-on-year change of CPI for January to July 2024 vs 2023
Headline Inflation
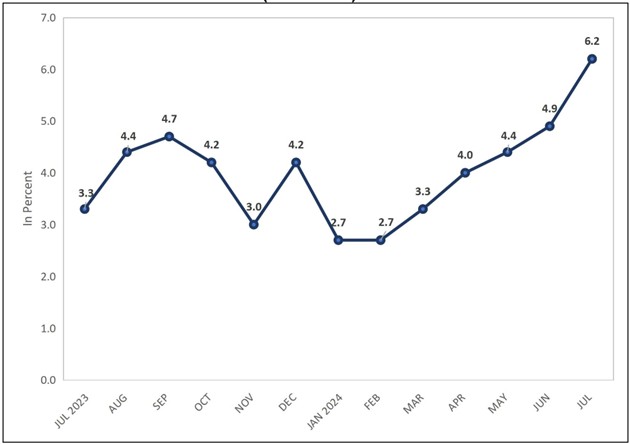
The overall inflation rate in Cagayan de Oro City reached 6.2 percent in July 2024, accelerating by 1.3 percentage points from 4.9 percent in June 2024. This contributed to an average inflation rate of 4.0 percent for the city from January to June 2024. Moreover, the city's inflation rate exceeded the national rate by 1.8 percentage points and the regional rate by 0.5 percentage points (see Table A).
The July 2024 inflation rate in the city was the highest since July 2023. It also showed a significant increase of 1.3 percentage points from the previous month's rate of 4.9 percent (Figure 1)
3rd Floor, Limketkai Module-2 BPO & Cyberpark Bldg., Rosario Crescent Limketkai Center, Brgy 31, Cagayan de Oro City
Contact Number: 09565766106 Email: misamisoriental@psa.gov.ph
Figure 1. Headline Inflation Rates in Cagayan de Oro City, All Items in Percent: July 2023 to July 2024
(2018=100)
Source: Philippine Statistics Authority, Retail Price Survey of Commodities for the Generation of Consumer Price Index
Main Drivers to the Upward Trend of the Headline Inflation
In July 2024, the primary driver of the increasing trend in the overall inflation was Food and Non-Alcoholic Beverages at 10.9 percent. It shown a faster inflation by 1.3 percentage point than in June 2024 at 9.6 percent. Housing, Water, Electricity, Gas and Other Fuels followed at 2.8 percent from 1.1 percent. Next was Education Services at 3.5 percent from -0.5 percent. The following commodity groups also posted faster inflation rates during the month compared to the preceding month: Transport at 3.6 percent from 2.3 percent; Restaurants and Accommodation Services at 7.2 percent from 5.8 percent; Health at 1.6 percent from 0.5 percent; Recreation, Sport and Culture at 1.6 percent from 0.0 percent; and Alcoholic Beverages and Tobacco at 8.2 percent from 7.9 percent.
Meanwhile, two commodity groups posted slower inflation rates in July 2024 than the previous month: Furnishings, Household Equipment and Routine
Household Maintenance at 7.6 percent from 7.8 percent; and Personal Care, and Miscellaneous Goods and Services at 2.2 percent from 2.5 percent.
Furthermore, three commodity groups retained their inflation rates in the previous month: clothing and footwear at -0.5 percent; information and communication at 0.4 percent; and financial services at 0.0 percent. (Table B)
Table B. Inflation Rates by Commodity Group in Cagayan de Oro City, in Percent: July 2023 and June to July 2024
(2018 = 100)
| Commodity Group | Jul 2023 | Jun 2024 | Jul 2024 |
| All Items | 3.3 | 4.9 | 6.2 |
| Food and Non-Alcoholic Beverages | 7.4 | 9.6 | 10.9 |
| Alcoholic Beverages and Tobacco | 4.0 | 7.9 | 8.2 |
| Clothing and Footwear | 0.6 | -0.5 | -0.5 |
| Housing, Water, Electricity, Gas and Other Fuels | 2.5 | 1.1 | 2.8 |
| Furnishings, Household Equipment and Routine Household Maintenance | 2.1 | 7.8 | 7.6 |
| Health | -1.4 | 0.5 | 1.6 |
| Transport | -9.8 | 2.3 | 3.6 |
| Information and Communication | 0.6 | 0.4 | 0.4 |
| Recreation, Sport and Culture | 0.7 | 0.0 | 1.6 |
| Education Services | 2.4 | -0.5 | 3.5 |
| Restaurants and Accommodation Services | 6.9 | 5.8 | 7.2 |
| Financial Services | 0.0 | 0.0 | 0.0 |
| Personal Care, and Miscellaneous Goods and Services | 6.4 | 2.5 | 2.2 |
Source: Philippine Statistics Authority, Retail Price Survey of Commodities for the Generation of Consumer Price Index
Food Inflation
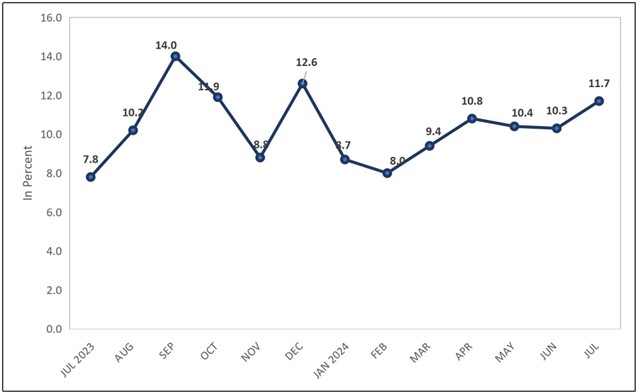
The city food inflation from 10.3 percent in June 2024 increased to 11.7 percent in July 2024. It was lower than the food inflation in September 2023 at 14.0 percent and December 2023 at 12.6 percent. On the other hand, it was higher than the rest of the months from July 2023 to June 2024. (Figure 2)
Figure 2. Food Inflation Rates in Cagayan de Oro City, in Percent:
July 2023 to July 2024
(2018=100)
Source: Philippine Statistics Authority, Retail Price Survey of Commodities for the Generation of Consumer Price Index
Purchasing Power of Peso
The Purchasing Power Peso (PPP) represents the real value of the peso in a specific period relative to the base period. Since 2018, the peso has experienced a gradual decline. From April 2024 to June 2024, the PPP for Cagayan de Oro City remained at 0.79, using 2018 as the base year.This month July, 2024 the PPP of the City went down to 0.78 which was also the PPP of Region 10 while in the Province of Misamis Oriental the PPP remained at 0.76.
(SGD.) MARIA LIZA M. BIGORNIA
(Chief Statistical Specialist)
Officer-In-Charge
| Attachment | Size |
|---|---|
|
|
460.1 KB |