

Release Date :
Reference Number :
2505ID02-007
Table A. Year-on-Year Inflation Rates
for the Bottom 30% Income Households, All Items In Percent
(2018=100)
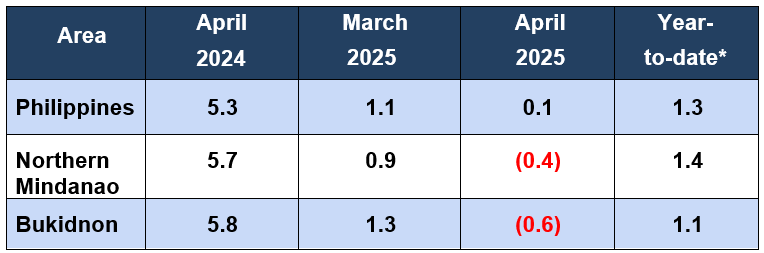
Source: Philippine Statistics Authority, Retail Price Survey of Commodities for the Generation of Consumer Price Index
*Year-on-year change of average CPI for January to April 2025 vs. 2024
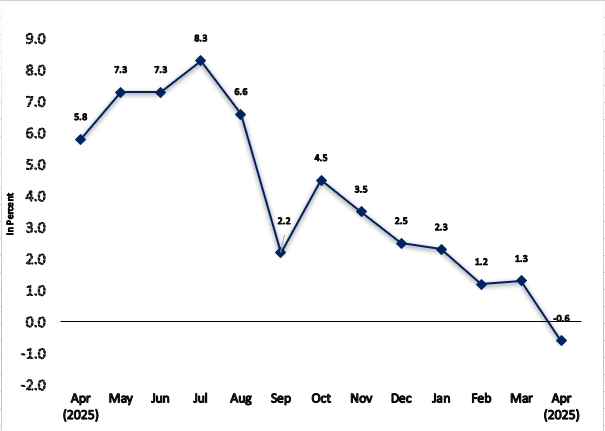
Figure 1. Inflation Rates for the Bottom 30% Income Households in Bukidnon, All Items (2018=100)
A. Bukidnon
1. Overall Inflation
The Province’s inflation rate for the bottom 30% income households slowed down further to an annual decrease of 0.6 percent in April 2025 from 1.3 percent in March 2025. In April 2024, the inflation rate was posted at 5.8 percent. (Figure 1, and Tables A, B, and 3)
1.1 Main Drivers to the Downward Trend of the Overall Inflation
The main driver to the Downward trend of the overall inflation for this income group in April 2025 was primarily brought about by the annual decline in the heavily weighted food and non-alcoholic beverages at 1.8 percent from an annual increase at 0.9 percent in the previous month. This was followed by transport which posted an annual decrease of 1.1 percent during the month from an annual increase at 3.1 percent in March 2025. In addition, housing, water, electricity, gas and other fuels index registered a slower annual increase of 1.4 percent in April 2025 from 2.1 percent in the previous month.
Moreover, slower annual increments were also noted in the indices of clothing and footwear at 0.9 percent during the month from 1.2 percent in March 2025, and health with 2.2 percent in April 2025 from 2.4 percent in March 2025.
On the other hand, higher annual growth rates were observed in the indices of the following commodity groups during the month:
a. Alcoholic beverages and tobacco, 2.2 percent from 1.8 percent;
b. Information and communication, 0.6 percent from 0.0 percent;
c. Restaurants and accommodation services, 2.9 percent from 1.7 percent; and
d. Personal care, and miscellaneous goods and services, 1.9 percent from 1.6 percent.
Moreover, a slower annual decrease was noted in the index of recreation, sport and culture at 1.5 percent during the month from 2.3 percent in March 2025.
The indices of the rest of the commodity groups retained their respective previous month’s annual rates. (Tables 3, and 4)
1.2 Main Contributors to Overall Inflation
The following commodity groups were the top three contributors to the April 2025 overall inflation for the bottom 30% income households:
a. Food and non-alcoholic beverages with 187.1 percent share or -1.12 percentage point;
b. Transport with 15.3 percent share or -0.09 percentage point; and
c. Recreation, sport and culture with 1.7 percent share or -0.01percentage point.
2. Food Inflation
Food inflation for the bottom 30% income households at the provincial level recorded with an annual declined at 2.0 percent in April 2025 from the annual increment at 0.9 percent in the previous month. In March 2024, its annual increase was observed at 9.9 percent. (Table 7)
2.1 Main Drivers to the Downward Trend of Food Inflation
The downtrend in the food inflation was mainly due to the faster annual decline in rice index recorded at 21.0 percent during the month from 10.5 percent annual drop in March 2025. Also contributing to the lower food inflation with a slower annual increment were corn at 6.7 percent during the month from 8.7 percent in March 2025, and fish and other seafood at 1.4 percent during the month from 3.7 percent in March 2025.
In addition, slower annual increase was recorded in the indices of milk, other dairy products and eggs at 2.7 percent during the month from 3.9 percent in the previous month.
Moreover, annual decreases were recorded in the indices of sugar, confectionery and desserts at 2.6 percent during the month from a 0.4 percent annual increase in March 2025, and ready-made food and other food products not elsewhere classified at 1.8 percent during the month from a 0.1 percent annual increase in March 2025.
Furthermore, a faster year-on-year decrease was observed in the index oils and fats at 4.1 percent during the month from 3.9 percent annual decline in March 2025.
On the contrary, faster annual growth rates during the month were observed in the indices of the following food groups:
a. Meat and other parts of slaughtered land animals, 9.8 percent from 7.8 percent;
b. Fruits and nuts, 19.6 percent from 12.2 percent; and
c. Vegetables, tubers, plantains, cooking bananas and pulses , 9.5 percent from 4.7 percent.
Moreover, a slower annual decrease of 1.6 percent was observed in the flour, bread and other bakery products, pasta products, and other cereals index during the month from a 1.8 percent year-on-year drop in March 2025. (Table 5)
2.1 Main Contributors to Food Inflation
Food inflation contributed 194.4 percent or -1.17 percentage points to the April 2025 overall inflation of the bottom 30% income households.
Among the food groups, the main contributors to food inflation during the month were the following:
a. Rice with 289.0 percent share or -5.78 percentage points;
b. Sugar, confectionery and desserts with 3.7 percent share or -0.07 percentage point; and
c. Ready-made food and other food products not elsewhere classified with 3.2 percent share or -0.06 percentage point.
Table B. Year-on-Year Inflation Rates for the Bottom 30% Income Households in Bukidnon, All Items: January 2020 to April 2025
In Percent (2018=100)
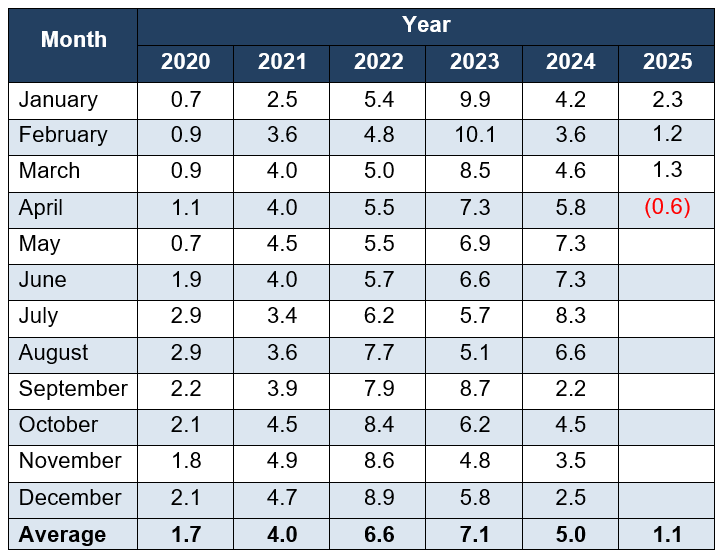
Source: Philippine Statistics Authority, Retail Price Survey of Selected Commodities for the Generation of Consumer Price Index
Note: CPIs and inflation rates for the bottom 30% income households by region are posted at the PSA OpenSTAT portal at https://openstat.psa.gov.ph/PXWeb/pxweb/en/DB/DB 2M PI BIH 2018/?tablelist=true.
(SGD.)MARIA EVANGELINE N. NON
Chief Statistical Specialist
| Attachment | Size |
|---|---|
|
|
371.48 KB |