

Release Date :
Reference Number :
PSA43-SR-2024-007
Table A. Year-on-Year Headline Inflation Rates, All Items in Percent:
April 2023, and March to April 2024
(2018=100)
| Area | Apr 2023 | Mar 2024 | Apr 2024 | Year- to-date* |
|---|---|---|---|---|
| Philippines | 6.6 | 3.7 | 3.8 | 3.4 |
| Region X | 6.4 | 3.9 | 4.5 | 3.8 |
| Misamis Oriental | 7.5 | 3.8 | 4.5 | 3.9 |
Source: Philippine Statistics Authority, Retail Price Survey of Commodities for the Generation of Consumer Price Index
*Year-on-year change of CPI for January to April, 2024 vs 2023
Headline Inflation
The Province of Misamis Oriental posted faster headline inflation or overall inflation in April 2024 at 4.5 percent than in March 2024 at 3.8 percent. This results in a 3.9 percent provincial average inflation rate from January 2024 to April 2024. In April 2024, provincial inflation was higher by 0.7 percentage point than the national inflation rate of 3.8 percent. Meanwhile, it was the same as the regional inflation rate during the month. (Table A)
The provincial inflation rate in April 2024 was higher than the inflation rates from January 2024 to March 2024. In contrast, it was lower than the inflation rates from April 2023 to December 2023. (Figure 1)
Figure 1. Headline Inflation Rates in Misamis Oriental,
All Items in Percent: April 2023 to April 2024
(2018=100)
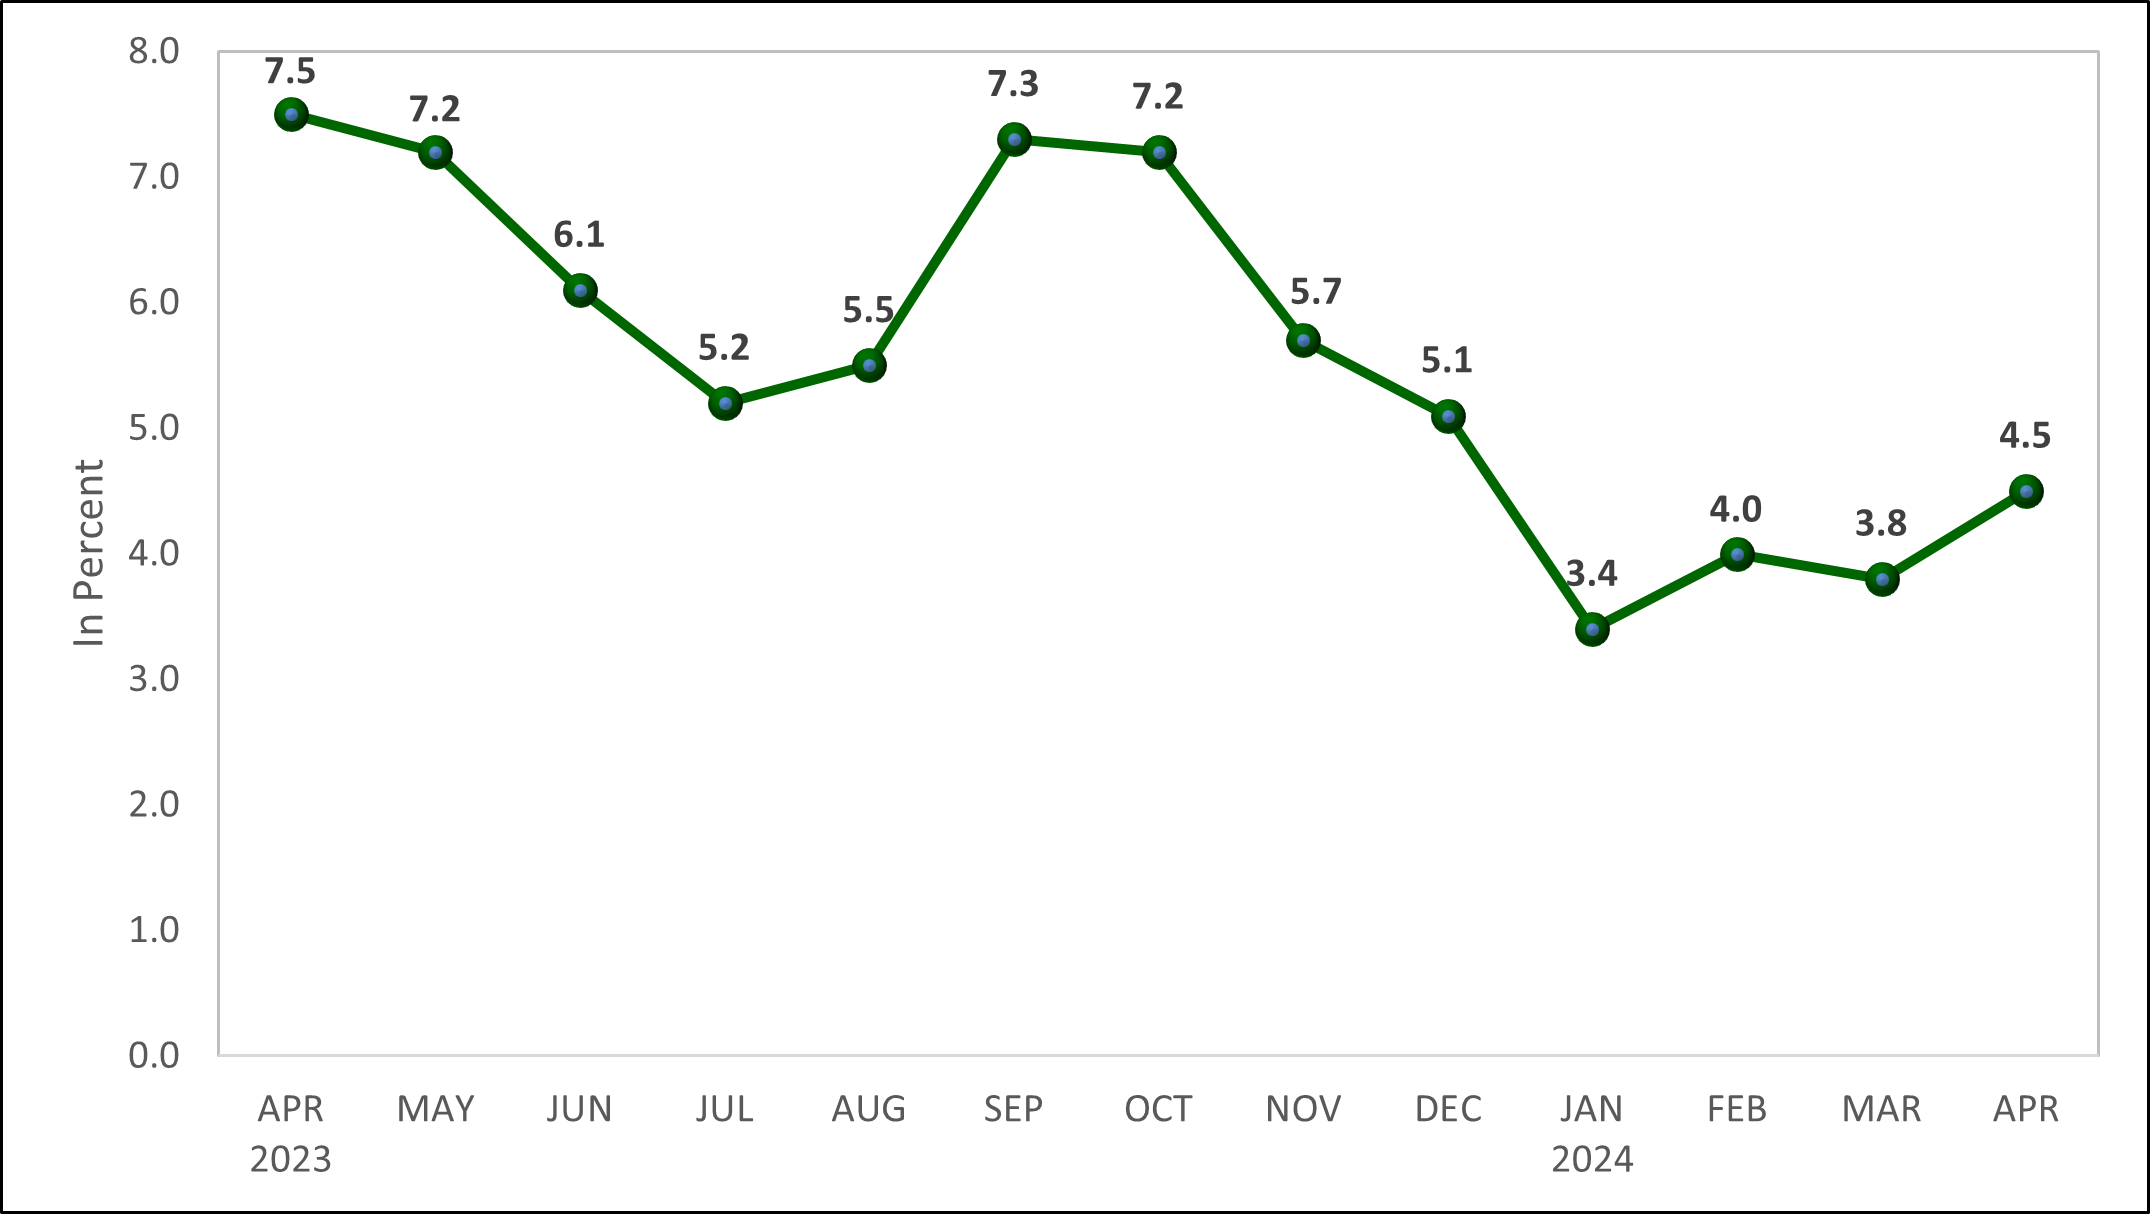
Source: Philippine Statistics Authority, Retail Price Survey of Commodities for the Generation of Consumer Price Index
Main Drivers to the Upward Trend of the Headline Inflation
The uptrend in the overall inflation in April 2024 was mainly brought about by food and non-alcoholic beverages at 8.8 percent. It was higher by 1.7 percentage points than the March 2024 inflation at 7.1 percent. This was followed by housing, water, electricity, gas and other fuels with a 0.5 percentage point higher inflation at -0.1 percent during the month from -0.6 percent in the previous month. Transport came next at 2.2 percent during the month which was higher by 1.1 percentage points than in March 2024. Additionally, faster inflation rates were also observed in the following commodity groups during the month compared to the preceding month: furnishings, household equipment and routine household maintenance at 2.2 percent from 1.0 percent; alcoholic beverages and tobacco at 10.3 percent from 9.2 percent; health at 0.7 percent from 0.2 percent; recreation, sport and culture at 4.0 percent from 2.2 percent; and clothing and footwear at 1.6 percent from 1.3 percent.
In contrast, only restaurants and accommodation services recorded a slower inflation rate in April 2024 at -0.7 percent. It decreased by 4.1 percentage points from March 2024 at 3.4 percent.
Furthermore, education services, financial services, and information and communication retained their inflation rates in the previous month at 0.1 percent, -0.1 percent, and 1.6 percent, respectively. (Table B)
Main Contributors to the Headline Inflation
The top three commodity groups contributing to the April 2024 overall inflation were the following:
- Food and non-alcoholic beverages with 85.2 percent share or 83 percentage points;
- Alcoholic beverages and tobacco with 6.3 percent share or 28 percentage points; and
- Transport with 4.4 percent share or 0.20 percentage points.
The rest of the commodity groups accounted for 4.1 percent share or 0.19 percentage points.
Table B. Inflation Rates by Commodity Group in Misamis Oriental,
in Percent: April 2023 and March to April 2024
(2018 = 100)
| Commodity Group | Apr 2023 | Mar 2024 | Apr 2024 |
| All Items | 7.5 | 3.8 | 4.5 |
| Food and Non-Alcoholic Beverages | 12.0 | 7.1 | 8.8 |
| Alcoholic Beverages and Tobacco | 4.5 | 9.2 | 10.3 |
| Clothing and Footwear | 7.0 | 1.3 | 1.6 |
| Housing, Water, Electricity, Gas and Other Fuels | 4.4 | -0.6 | -0.1 |
| Furnishings, Household Equipment and Routine Household Maintenance | 4.3 | 1.0 | 2.2 |
| Health | 2.9 | 0.2 | 0.7 |
| Transport | -0.3 | 1.1 | 2.2 |
| Information and Communication | 2.3 | -1.6 | -1.6 |
| Recreation, Sport and Culture | 2.2 | 2.2 | 4.0 |
| Education Services | 1.8 | 0.1 | 0.1 |
| Restaurants and Accommodation Services | 6.1 | 3.4 | -0.7 |
| Financial Services | 0.0 | -0.1 | -0.1 |
| Personal Care, and Miscellaneous Goods and Services | 8.4 | 3.0 | 3.1 |
Source: Philippine Statistics Authority, Retail Price Survey of Commodities for the Generation of Consumer Price Index
Food Inflation
The provincial food inflation in April 2024 increased to 8.8 percent from 7.2 percent in the previous month. It was also higher than the food inflation from January 2024 to February 2024. Meanwhile, it was lower than the food inflation posted from April 2023 to December 2023. (Figure 2)
As shown in Table C, the Consumer Price Index (CPI) of food in the province recorded 139.2 in April 2024, which was higher than the CPI in April 2023 and March 2024 at 127.9 and 137.8, respectively. On average, prices have increased by 39.2 percent since the base year of 2018, when the CPI was at 100. The base year serves as a reference point for comparison to see how much prices have changed over time.
Figure 2. Food Inflation Rates in Misamis Oriental, in Percent:
April 2023 to April 2024
(2018=100)

Source: Philippine Statistics Authority, Retail Price Survey of Commodities for the Generation of Consumer Price Index
Main Drivers to the Upward Trend of the Food Inflation
The acceleration of food inflation in April 2024 was mainly driven by the faster inflation rate in fish and other seafood at 5.3 percent. It was 5.7 percentage points higher than the -0.4 percent in March 2024. Vegetables, tubers, plantains, cooking bananas and pulses followed with 3.8 percentage points higher food inflation at -6.1 percent during the month from -9.9 percent in the previous month. Milk, other dairy products and eggs with a 2.2 percentage points higher than the 4.6 percent inflation recorded in the previous month at 6.8 percent in April 2024. The following food groups also posted faster inflation during the month compared to the previous month:
- Meat and other parts of slaughtered land animals, 2.3 percent from 2 percent;
- Ready-made food and other food products n.e.c., 6.6 percent from 2 percent;
- Sugar, confectionery and desserts, -2.4 percent from -3.5 percent; and
- Oils and fats, -3.6 percent from -4.0 percent.
In contrast, two food groups recorded slower inflation in April 2024 than in March 2024:
- Cereals and cereal products, 20.8 percent from 21.1 percent; and
- Fruits and nuts, 12.9 percent from 19.7 percent.
Furthermore, rice inflation decreased to 30.4 percent in April 2024 from 30.7 percent in the previous month. Meanwhile, corn inflation at 6.4 percent during the month was faster than in March 2024 at 4.3 percent. (Table C)
Main Contributors to the Increasing Trend of Food Inflation
In April 2024, food inflation shared 79.3 percent or 3.57 percentage points to the overall inflation. The top three food groups in terms of contribution to the food inflation during the month were the following:
- Cereals and cereal products with 81.4 percent share or 7.16 percentage points;
- Fruits and nuts with 7.7 percent share or 0.68 percentage points; and
- Milk, other dairy products and eggs with 6.0 percent share or 53 percentage points.
On the other hand, the remaining food groups shared 4.9 percent or contributed 0.43 percentage points to the total food inflation.
Table C. Consumer Price Index, and Year-on-Year Percent Changes
by Food Group in Misamis Oriental
(2018 = 100)
| Commodity Group | Consumer Price Index (CPI) | Inflation Rates (in %) | |||
| Apr 2023 | Mar 2024 | Apr 2024 | Mar 2024 | Apr 2024 | |
| Food | 127.9 | 137.8 | 139.2 | 7.2 | 8.8 |
| Cereals and Cereal Products | 99.8 | 120.1 | 120.6 | 21.1 | 20.8 |
| Cereals | 95.4 | 118.7 | 119.7 | 25.4 | 25.5 |
| Rice | 88.5 | 114.7 | 115.4 | 30.7 | 30.4 |
| Corn | 137.3 | 143.4 | 146.1 | 4.3 | 6.4 |
| Flour, Bread and Other Bakery Products, Pasta Products, and Other Cereals | 125.1 | 127.8 | 125.4 | 2.3 | 0.2 |
| Meat And Other Parts of Slaughtered Land Animals | 155.3 | 157.0 | 158.8 | 1.2 | 2.3 |
| Fish And Other Seafood | 155.0 | 157.0 | 163.2 | -0.4 | 5.3 |
| Milk, Other Dairy Products and Eggs | 116.9 | 122.8 | 124.8 | 4.6 | 6.8 |
| Oils And Fats | 123.5 | 118.6 | 119.1 | -4.0 | -3.6 |
| Fruits And Nuts | 167.3 | 184.8 | 188.9 | 19.7 | 12.9 |
| Vegetables, Tubers, Plantains, Cooking Bananas and Pulses | 157.0 | 153.8 | 147.4 | -9.9 | -6.1 |
| Sugar, Confectionery and Desserts | 152.2 | 147.1 | 148.5 | -3.5 | -2.4 |
| Ready-Made Food and Other Food Products N.E.C. | 132.0 | 138.5 | 140.7 | 5.2 | 6.6 |
Source: Philippine Statistics Authority, Retail Price Survey of Commodities for the Generation of Consumer Price Index
Note: CPIs and inflation rates by province and selected city are posted at the PSA OpenSTAT portal accessible at https://www.psa.gov.ph
(SGD.)MARIA LIZA M. BIGORNIA
(Chief Statistical Specialist)
Officer-In-Charge
| Attachment | Size |
|---|---|
|
|
196.42 KB |