

Release Date :
Reference Number :
CPIBuk13-2024-05
TABLE A. Year-on-Year Inflation Rates, All Items
In Percent
(2018=100)
| Area | April 2023 | March 2024 | April 2024 | Year-to-date* |
Philippines Headline | 6.6 | 3.7 | 3.8 | 3.4 |
Northern Mindanao Headline | 6.4 | 3.9 | 4.5 | 3.8 |
Bukidnon Headline | 7.3 | 5.0 | 5.5 | 5.2 |
Source: Retail Price Survey of Commodities for the Generation of Consumer Price Index Philippine Statistics Authority
Source: Retail Price Survey of Commodities for the Generation of Consumer Price Index Philippine Statistics Authority
Bukidnon
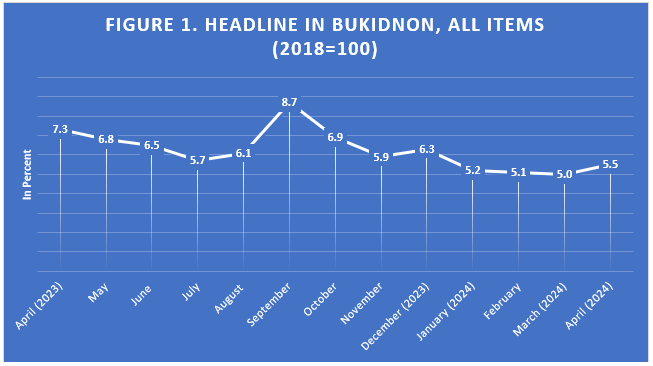
The headline inflation or the average rate of change of prices of goods and services in the province of Bukidnon was recorded at 5.5 percent in April 2024. The inflation rate in March 2024 was registered at 5.0 percent, and 7.3 percent in April 2023. The year-to-date inflation in 2024 is at 5.2 percent.
The main sources of the uptrend of the April 2024 inflation rate are the commodity groups Food and Non-Alcoholic Beverages at 9.4 percent from 7.5 percent attributed by Cereals and cereal products with inflation rate of 22.4 percent. Second is Transport at 10.8 percent from 8.9 percent. Lastly, Furnishings, Household Equipment and routine household maintenance at 10.8 percent from 9.4 percent.
Selected food items that recorded a higher inflation in April 2024 were Rice at 35.9 percent; Fruits and Nuts at 23 percent; Ready-made Food and other food products at 9.2 percent; Flour, Bread and Other Bakery Products, Pasta Products, and Other Cereals at 9.1 percent; Milk, other dairy products, and eggs at 9.0 percent; Corn at 3.6 percent; Sugar, confectionery and desserts at 2.7 percent; and other seafood at 2.0 percent.
Higher annual increments in April 2024 were observed in the following indices:
- Food and Non-Alcoholic Beverages, 9.4 percent from 7.5 percent
- Furnishing, Household Equipment and Routine Household Maintenance, 10.8 percent from 9.4 percent
- Health, 7.5 percent from 7.4 percent
- Transport, 10.8 percent from 8.9 percent
- Restaurants and Accommodation Services, 0.8 percent from 0.7 percent
Lower year-on-year mark-ups were noted in the indices of the following commodity groups during the month:
- Alcoholic Beverages and Tobacco, 4.1 percent from 8.4 percent
- Housing, Water, Electricity, Gas and Other Fuels, -5.6 percent from -3.2 percent
- Information and Communication, 0.2 percent from 0.3 percent
- Recreation, Sport and Culture, 9.2 percent from 9.8 percent
- Personal Care, and Miscellaneous Goods and Services, 2.9 percent from 3.5 percent
Constant inflation was also recorded for following indices:
- Clothing and Footwear, 6.2 percent
- Education Services, 17.9 percent
- and Financial Services, 0.0 percent
Table B. Year-on-Year Inflation Rates in Bukidnon, All Items in Percent
January 2019 – April 2024
(2018=100)
| Month | Year | |||||
| 2019 | 2020 | 2021 | 2022 | 2023 | 2024 | |
| January | 7.0 | 1.0 | 2.1 | 4.5 | 8.3 | 5.2 |
| February | 5.9 | 1.2 | 3.0 | 4.1 | 8.5 | 5.1 |
| March | 5.7 | 1.0 | 3.5 | 4.4 | 8.5 | 5.0 |
| April | 5.7 | 1.0 | 3.7 | 5.0 | 7.3 | 5.5 |
| May | 5.3 | 0.9 | 3.8 | 5.2 | 6.8 | |
| June | 4.6 | 1.8 | 3.2 | 5.4 | 6.5 | |
| July | 2.7 | 2.7 | 2.6 | 6.0 | 5.7 | |
| August | 1.4 | 2.9 | 2.7 | 6.5 | 6.1 | |
| September | 0.3 | 2.5 | 3.5 | 6.6 | 8.7 | |
| October | -0.4 | 2.4 | 3.8 | 7.0 | 6.9 | |
| November | 0.8 | 1.5 | 4.4 | 7.0 | 5.9 | |
| December | 1.1 | 1.8 | 4.1 | 7.3 | 6.3 | |
| Average | 3.2 | 1.7 | 3.4 | 5.8 | 7.1 | 5.2 |
Source: Retail Price Survey of Commodities for the Generation of Consumer Price Index Philippine Statistics Authority
Note:
CPIs and inflation rates by province and selected city are posted at PSA website (https://openstat.psa.gov.ph/).
(SGD.)MARIA EVANGELINE N. NON
Chief Statistical Specialist
| Attachment | Size |
|---|---|
|
|
954.71 KB |