

Release Date :
Reference Number :
PSAX-SR-2025-05
The total population of Northern Mindanao as of 01 May 2020 reached 5,022,768 based on the results of the 2020 Census of Population and Housing (2020 CPH). Of this total, the household population comprised 5,007,798 persons. This had ranked Northern Mindanao in the top 9 of the most populous regions in the country. The population as of 2020 is higher by 333,466 compared to the population of 4.69 million in 2015.
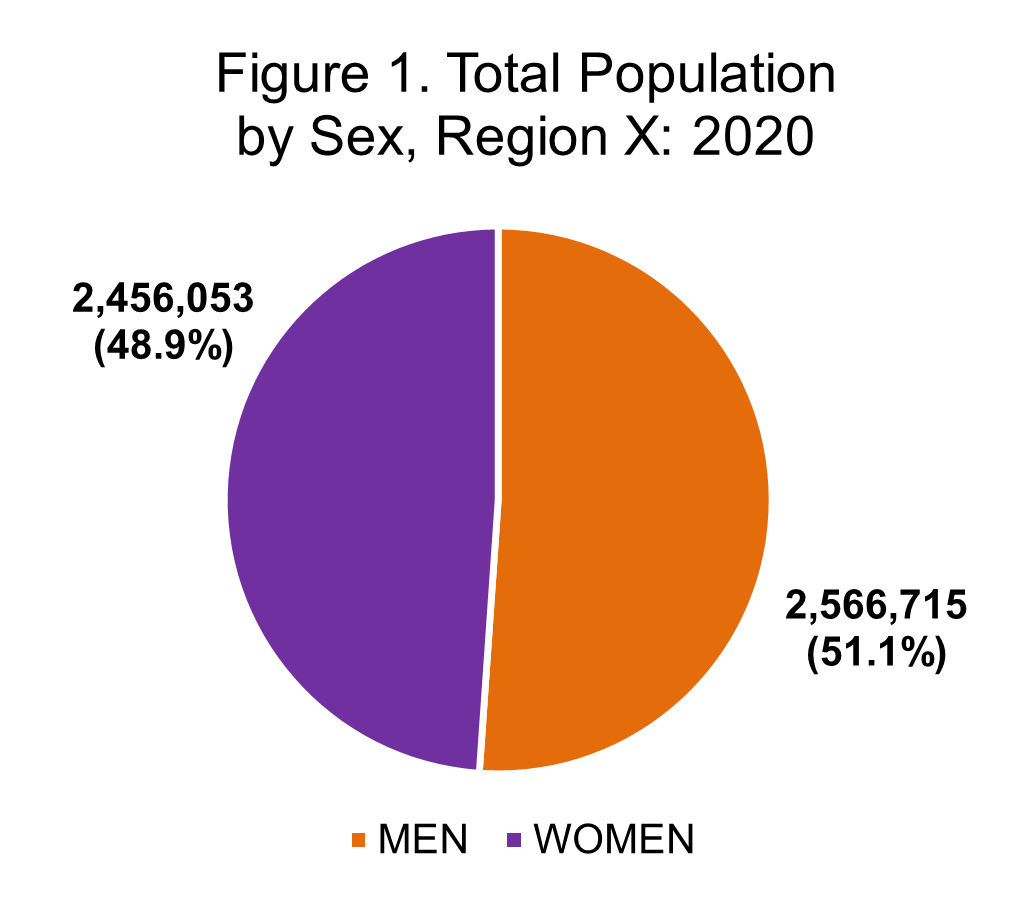
Comparison of Women and Men Population
Source: Philippine Statistics Authority, 2020 Census of Population
In 2020, the recorded population of men in Northern Mindanao was about 51.1 percent of the total population. This was higher than that of women which was posted at 48.9 percent of the total population. This resulted to a sex ratio of 104 men per 100 women, showing domination of men over women population.
Source: Philippine Statistics Authority, 2020 Census of Population
In terms of the household population, Table 1 shows that the region recorded more men posted at 2,554,944 persons than women posted
at 2,452,854 persons.
Table 1. Household Population by Sex and Province/HUCs, Region X: 2020
| Region/Province/City | Both Sexes | Male | Female |
| Region X | 5,007,798 | 2,554,944 | 2,452,854 |
| Bukidnon | 1,537,629 | 798,656 | 738,973 |
| Camiguin | 92,696 | 47,131 | 45,565 |
| Lanao del Norte | 721,716 | 362,139 | 359,577 |
| Misamis Occidental | 614,951 | 310,907 | 304,044 |
| Misamis Oriental | 954,953 | 489,483 | 465,470 |
| Cagayan de Oro City | 723,671 | 364,706 | 358,965 |
| Iligan City | 362,182 | 181,922 | 180,260 |
Source: Philippine Statistics Authority, 2020 Census of Population
The province of Bukidnon recorded the highest household population count for both men and women among all the provinces and highly-urbanized cities (HUCs) in the region. Its household population of 1,537,629 comprised of about 51.9 percent men and about 48.1 percent women.
Age Structure
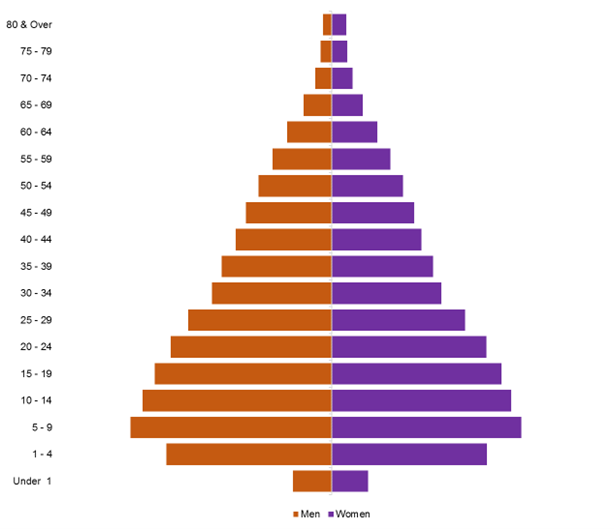
Figure 2. Population Pyramid, Region X: 2020
Source: Philippine Statistics Authority, 2020 Census of Population
In general, the age structure of Northern Mindanao population followed the typical shape of the population pyramid with a narrow top composed of the elderly and a relatively broad base consisting of children. (Figure 2)
Young dependents belonging to age group 0 to 14 years comprised 33.0 percent of the population. The old dependents (65 years and over) accounted for 4.9 percent, while 62.1 percent comprised the economically active population (15 to 64 years).
The 2020 dependency ratio was 53.2. This meant that for every 100 persons in the working age group (15-64 years), they had to support about 53 young dependents.
Voting Population
The total number of Region X voting population was posted at 3,058,542 persons. There was an almost 50-50 percent distribution by sex, with the men 50.8 percent outpacing slightly the women with 49.2 percent were women. The voting population comprises the population belonging to age group 18 years and above.
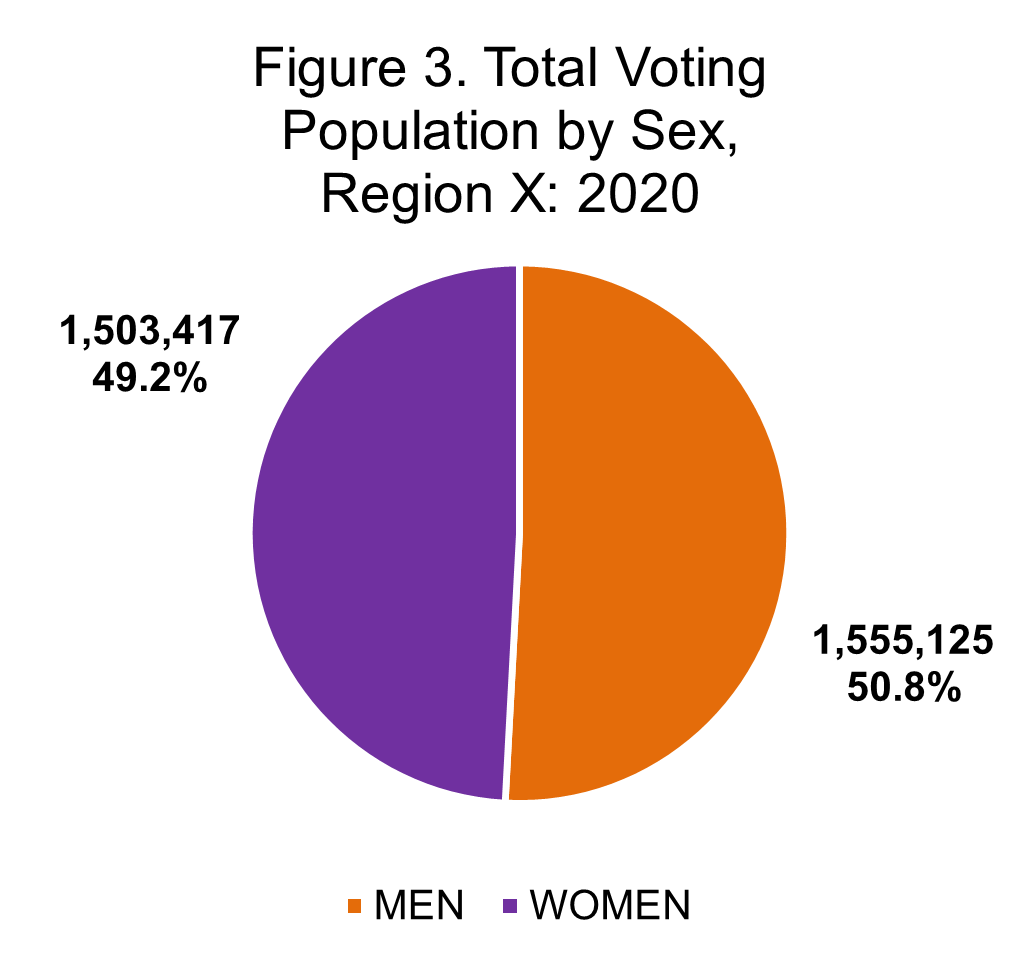
Source: Philippine Statistics Authority, 2020 Census of Population
Youth Population
In 2020, the population of the youth was about 29.0 percent of the total population of the region. This youth population comprised those in the age group 15 to 30 years. The young men population was about 51.1 percent of the total population of youth, while that of women was about 48.9 percent. Men outnumbered the women in the youth population by about 2.3 percentage points.
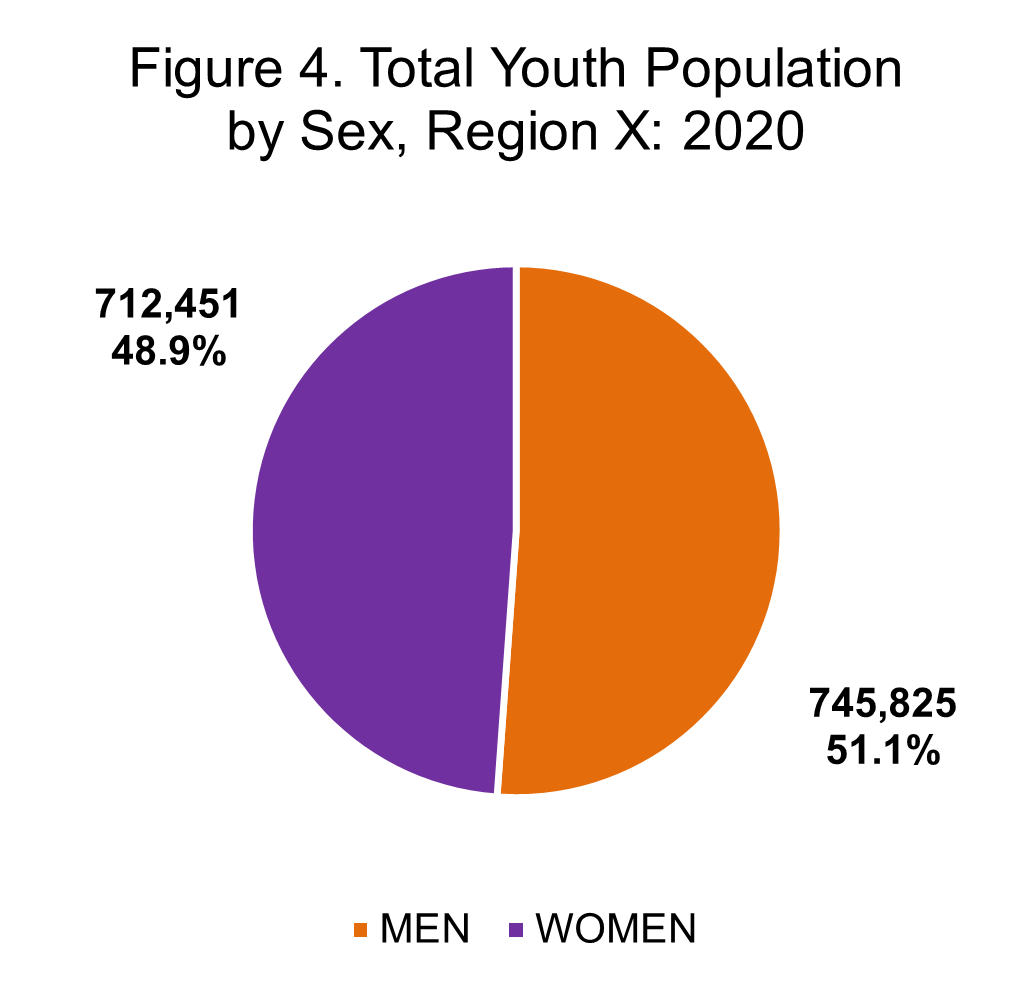
Source: Philippine Statistics Authority, 2020 Census of Population
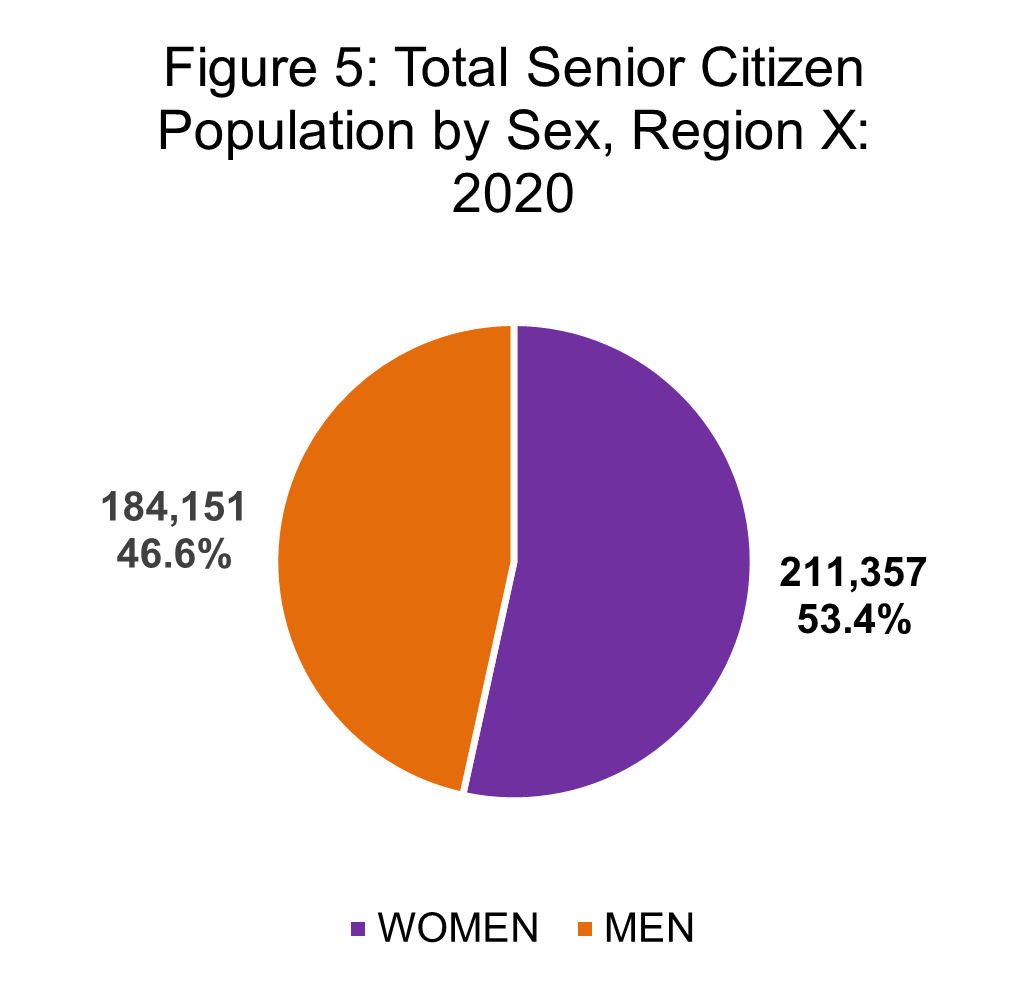
Population of Senior Citizens
The Senior Citizen (SC) population in 2020 was recorded at about 7.9 percent of the total population of the region. The SC were those that belonged to age group 60 years and above. There were about 46.6 percent men SC while about 53.4 percent were women SC. This indicated that in the Senior Citizen age group, women SC outnumbered the men SC by about 6.9 percentage points.
Source: Philippine Statistics Authority, 2020 Census of Population
The Population Based on the Marital Status
In 2020, women 10 years old and over in Northern Mindanao totaled 1,914,271. Most of the women were either single or married, with the proportion of married women higher than that of single women.
On the other hand, the total number of men of the same age was 1,980,178. Majority were also either single or married, but with the proportion of single men higher than that of the married ones.
Table 2. Household Population 10 Years Old and Over by Marital Status and Sex, Region 10: 2020
| Marital Status | Both Sexes | Men | Women |
Region X Single Married Widowed Divorced/ Separated Common-Law/ Live-in Unknown | 3,894,449 1,548,277 1,596,970 164,430 66,511 518,005 256 | 1,980,178 847,807 800,374 42,793 28,623 260,500 81 | 1,914,271 700,470 796,596 121,637 37,888 257,505 175 |
| Source: Philippine Statistics Authority, 2020 Census of Population and Housing (2020 CPH) | |||
It can also be noted that 13.3 percent of the total number of household population of the same age were in live-in relationships, with both sexes sharing a 50:50 ratio.
Vital Statistics
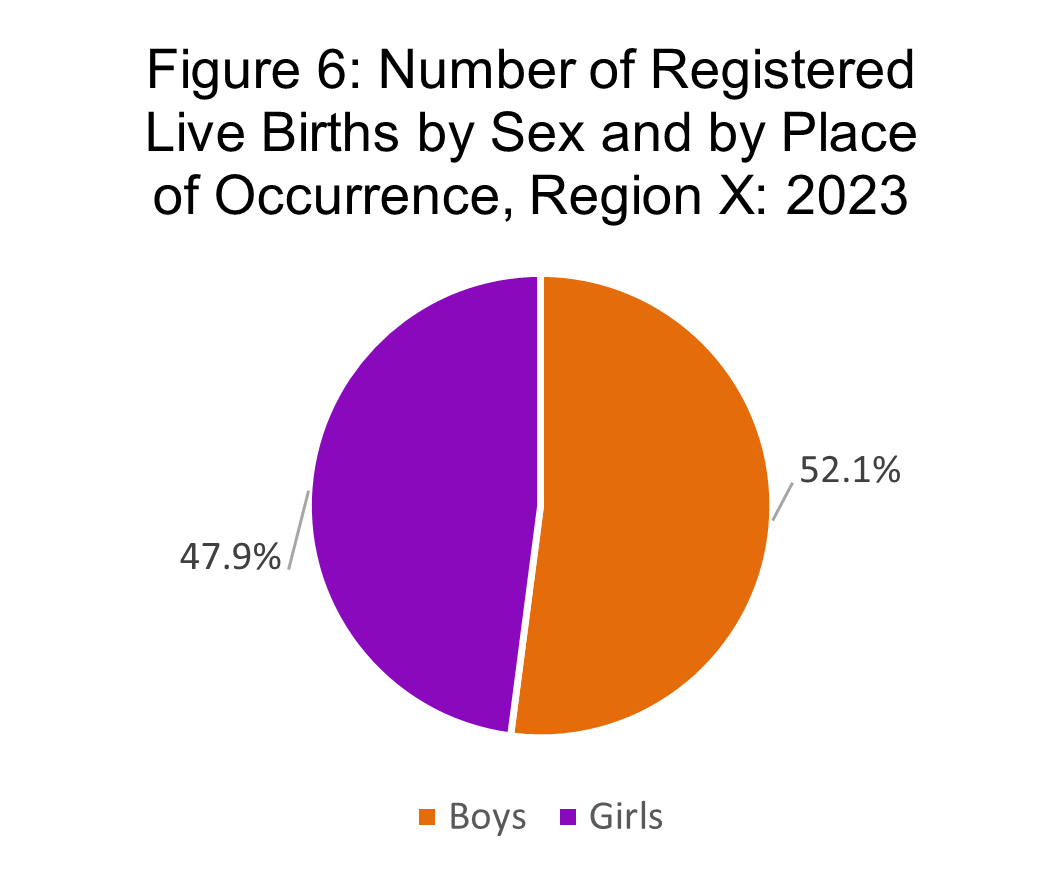
Live Births
In 2023, the region recorded 81,648 live births by place of occurrence, of which 52.1 percent were boys while 47.9 percent were girls. (Figure 6) This number accounted for 5.6 percent of the total live births by occurrence in the country. (Table 3)
Source: Philippine Statistics Authority, 2023 Vital Statistics
Meanwhile, on the same year, the number of live births by usual residence registered at 79,551. This was about 5.5 percent of the total live births by usual residence in the country.
Table 3. Number of Registered Live Births by Place of Occurrence and Usual Residence, Sex, Province, and Highly Urbanized City, Region X: 2023
| Region of Residence | Place of Occurrence | Usual Residence | ||||
| Both Sexes | Men | Women | Both Sexes | Men | Women | |
| Philippines | 1,448,522 | 753,332 | 695,190 | 1,448,522 | 753,332 | 695,190 |
Region X Bukidnon Camiguin Lanao del Norte Misamis Occidental Misamis Oriental Cagayan de Oro City Iligan City | 81,648 26,850 685 7,820 11,633 10,298 17,783 6,579 | 42,510 13,959 352 3,997 6,165 5,285 9,335 3,417 | 39,138 12,891 333 3,823 5,468 5,013 8,448 3,162 | 79,551 27,484 719 9,202 9,741 14,922 12,090 5,393 | 41,469 14,308 366 4,759 5,193 7,740 6,327 2,776 | 38,082 13,176 353 4,443 4,548 7,182 5,763 2,617 |
Source: Philippine Statistics Authority, 2023 Vital Statistics
In terms on the site of delivery of the registered births, 92.8 percent were delivered in a health facility, whether in a hospital, barangay health centers, lying-in clinic, and the like. On the other hand, about 6.5 percent were delivered at home and 0.8 percent were delivered in sites other than health facility and home. (Table 4)
Table 4. Number of Registered Live Births by Site of Delivery, by Place of Occurrence, by Province, and by Highly Urbanized City, Region X: 2023
| Place of Occurrence | Site of Delivery | |||
| Total | Health Facility | Home | Others | |
| Philippines | 1,448,522 | 1,363,758 | 76,265 | 8,499 |
Region X Bukidnon Camiguin Lanao del Norte Misamis Occidental Misamis Oriental Cagayan de Oro City Iligan City | 81,648 26,850 685 7,820 11,633 10,298 17,783 6,579 | 75,744 24,706 677 5,878 11,061 9,602 17,490 6,330 | 5,270 1,816 4 1,913 487 655 146 249 | 634 328 4 29 85 41 147 - |
Source: Philippine Statistics Authority, 2023 Vital Statistics
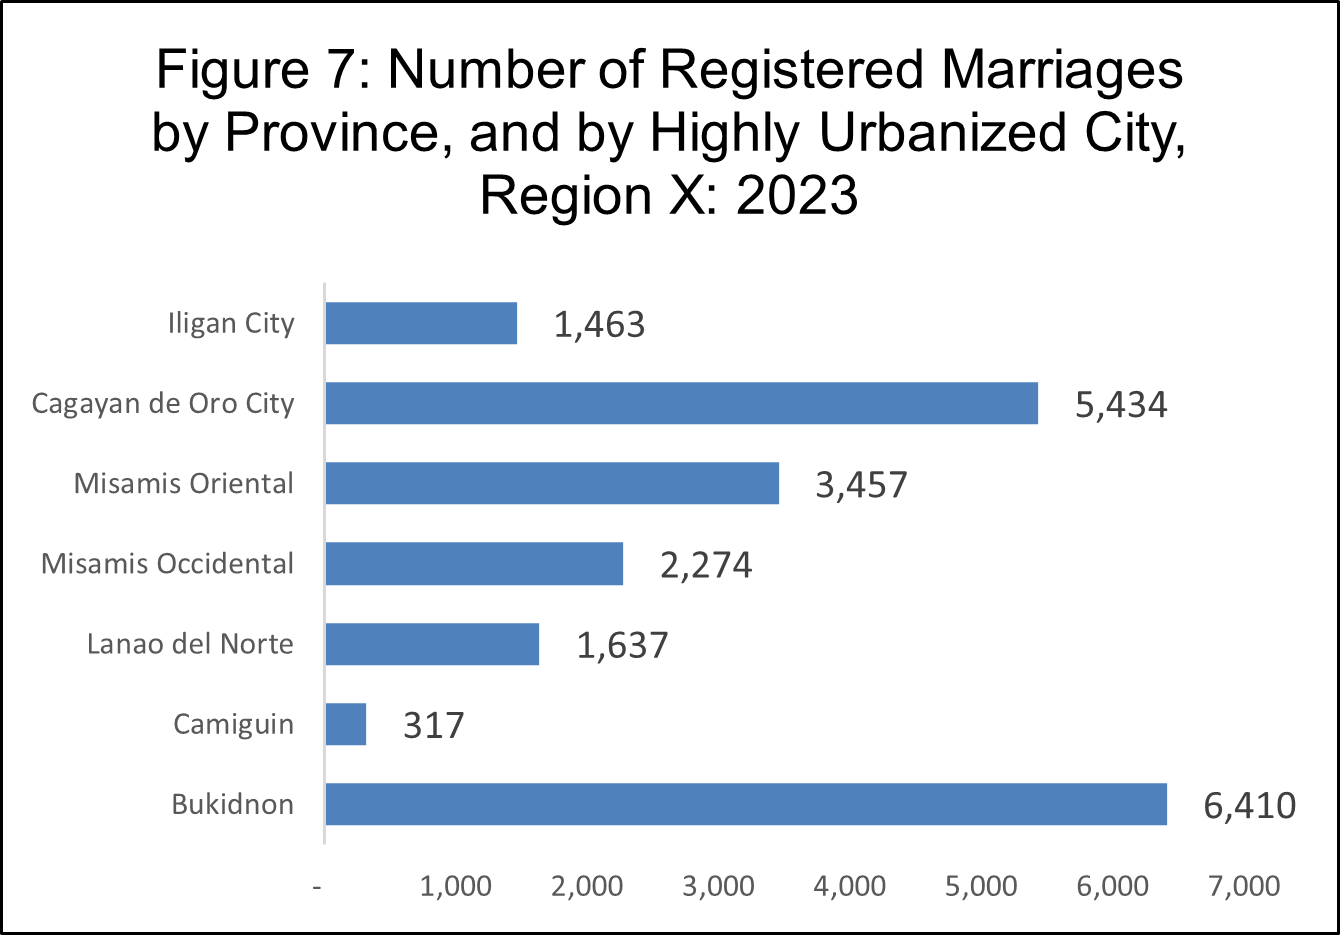
Marriages
A total of 20,992 marriages were registered in the region for the year 2023.
Among provinces and highly urbanized cities, Bukidnon had the highest number with 6,410 marriages. This accounted for 30.5 percent of the regional total. On the other hand, Camiguin recorded the lowest registered marriages at 317.
Source: Philippine Statistics Authority, 2023 Vital Statistics
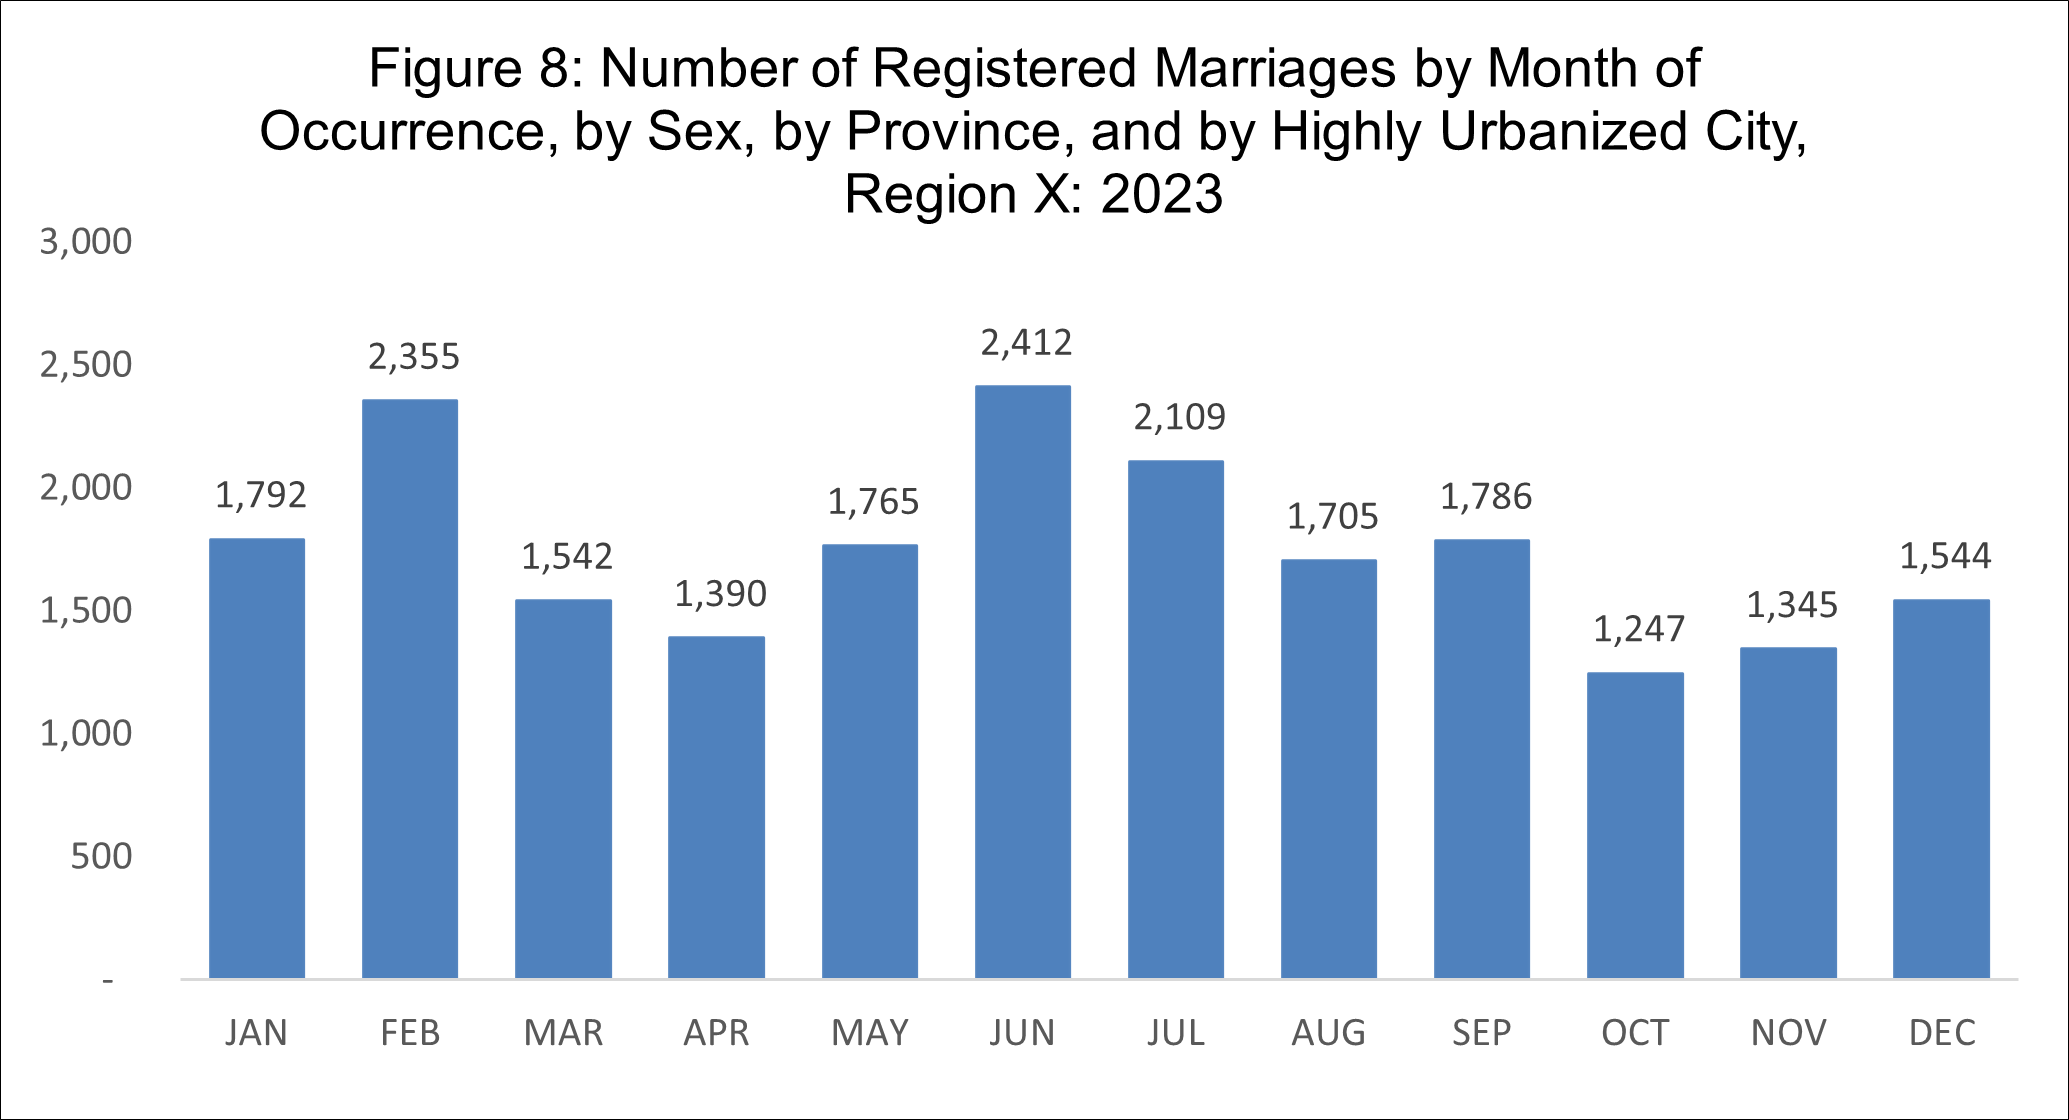
It was in the month of June when the highest number of marriages took place at 2,412, followed by the months of February, July, January, and September. Meanwhile, the lowest number of registered marriages took place in October 2023 with only 1,247. (Figure 8)
Source: Philippine Statistics Authority, 2023 Vital Statistics
Deaths
The region registered 31,768 deaths in 2023, comprising of 57.3 males and 42.7 females. More death with males were recorded in all provinces and highly urbanized cities in Northern Mindanao.
Bukidnon recorded the highest number at 9,205 deaths, followed by the province of Misamis Oriental at 6,554.
Table 5. Number of Registered Deaths by Sex, by Province, and by Highly Urbanized City, Region X: 2023
| Region/Province/City | Both Sexes | Male | Female |
| Region X | 31,768 | 18,210 | 13,558 |
| Bukidnon | 9,205 | 5,377 | 3,828 |
| Camiguin | 696 | 403 | 293 |
| Lanao del Norte | 3,146 | 1,806 | 1,340 |
| Misamis Occidental | 4,771 | 2,617 | 2,154 |
| Misamis Oriental | 6,554 | 3,762 | 2,792 |
| Cagayan de Oro City | 4,877 | 2,816 | 2,061 |
| Iligan City | 2,519 | 1,429 | 1,090 |
Source: Philippine Statistics Authority, 2020 Census of Population
Note: Preliminary data as of 31 August 2024
The Population based on Functional Difficulty
The Functional Difficulty is referred to a person with difficulty in functioning may have activity limitations, which means difficulties an individual may have in executing activities. In general, functional difficulties experienced by people may have been due to their health conditions.
For the 2020 CPH, the data on functional difficulty of the household members five years and over were collected by asking the respondents whether each member have difficulty in seeing, even if wearing eyeglasses; hearing, even if using a hearing aid; walking or climbing steps; remembering or concentrating; self-caring; and/or communicating using their usual language.
The questions cover six (6) functional domains: seeing, hearing, walking, cognition, self-care, and communication. Each question has four (4) response categories: (1) No, no difficulty, (2) Yes, some difficulty, (3) Yes, a lot of difficulty and (4) Cannot do it at all.
In 2020, there were 332,177 household population five (5) years old and over with at least one domain of category of functional difficulty regardless of severity out of the 4,461,503 household population aged five (5) years and over in Region X. This is composed of 46.4 percent men
and 53.6 percent women. (Table 6)
Table 6. Household Population With at Least One Domain or Category
of Functional Difficulty Regardless of Severity, Region X: 2020
| Region of Residence | Both Sexes | Men | Women |
| Philippines | 8,469,426 | 3,763,241 | 4,706,185 |
| Region X | 332,177 | 154,012 | 178,165 |
| Source: Philippine Statistics Authority, 2020 Census of Population and Housing (2020 CPH) Note: Percent distribution may not sum up to 100 due to rounding | |||
Of the 332,177 persons with at least one domain of functional difficulty, about 84.1 percent were reported to have mild cases; 11.0 percent
had moderate cases, and 4.9 percent had severe cases. (Table 7)
Severe cases of functional difficulty were most common among the elderly (60 years old and over) and children aged 5 to 14. Of the 16,271 severe cases of functional difficulty, persons aged 80 years and above posted the highest prevalence rate (2,480 cases or 15.2%). By sex, the prevalence rate in this age group 80 years and over was more pronounced among women (10.5%) than among men (4.8%).
Table 7. Household Population With at Least One Domain or Category
of Functional Difficulty by Age Group and Level of Severity, Region X: 2020
| Region of Residence and Age Group | Level of Severity | |||||||||
| With at Least One Domain or Category of Mild Functional Difficulty | With at Least One Domain or Category of Moderate Functional Difficulty | With at Least One Domain or Category of Severe Functional Difficulty | ||||||||
| Both Sexes | Men | Women | Both Sexes | Men | Women | Both Sexes | Men | Women | ||
| Region X | 279,242 | 128,069 | 151,173 | 36,664 | 17,819 | 18,845 | 16,271 | 8,124 | 8,147 | |
| 5 - 9 | 4,164 | 2,286 | 1,878 | 1,245 | 709 | 536 | 1,400 | 783 | 617 | |
| 10 - 14 | 3,307 | 1,662 | 1,645 | 1,112 | 652 | 460 | 1,043 | 589 | 454 | |
| 15 - 19 | 4,104 | 1,778 | 2,326 | 1,070 | 593 | 477 | 881 | 496 | 385 | |
| 20 - 24 | 5,950 | 2,399 | 3,551 | 1,143 | 630 | 513 | 913 | 527 | 386 | |
| 25 - 29 | 7,325 | 3,070 | 4,255 | 1,206 | 635 | 571 | 871 | 466 | 405 | |
| 30 - 34 | 8,458 | 3,839 | 4,619 | 1,287 | 710 | 577 | 865 | 478 | 387 | |
| 35 - 39 | 9,836 | 4,366 | 5,470 | 1,252 | 639 | 613 | 651 | 333 | 318 | |
| 40 - 44 | 18,236 | 8,386 | 9,850 | 1,508 | 851 | 657 | 698 | 364 | 334 | |
| 45 - 49 | 26,974 | 12,639 | 14,335 | 1,926 | 1,035 | 891 | 676 | 383 | 293 | |
| 50 - 54 | 33,510 | 15,968 | 17,542 | 2,558 | 1,353 | 1,205 | 747 | 402 | 345 | |
| 55 - 59 | 35,383 | 16,961 | 18,422 | 2,872 | 1,514 | 1,358 | 861 | 460 | 401 | |
| 60 - 64 | 36,771 | 17,588 | 19,183 | 3,502 | 1,765 | 1,737 | 1,040 | 566 | 474 | |
| 65 - 69 | 30,822 | 14,524 | 16,298 | 3,548 | 1,740 | 1,808 | 1,044 | 548 | 496 | |
| 70 - 74 | 22,865 | 10,326 | 12,539 | 3,444 | 1,650 | 1,794 | 1,055 | 510 | 545 | |
| 75 - 79 | 15,244 | 6,369 | 8,875 | 3,267 | 1,347 | 1,920 | 1,046 | 445 | 601 | |
| 80 years and above | 16,293 | 5,908 | 10,385 | 5,724 | 1,996 | 3,728 | 2,480 | 774 | 1,706 | |
Source: Philippine Statistics Authority, 2020 Census of Population and Housing (2020 CPH)
Note: Percent distribution may not sum up to 100 due to rounding
The next highest prevalence rate of severe cases was observed in children aged 5 to 9 years (1,400 cases or 8.6%). However, the prevalence rate of severe cases among persons in this age group was slightly higher among men (783 cases or 4.8%) than among women (617 cases or 3.8%).
Of the total 36,664 moderate cases, persons aged 80 years and over posted the highest prevalence rate (5,724 cases or 15.6%). It was followed by those in the age groups 65 to 69 years (3,548 cases or 9.7%). By sex, the prevalence rate of moderate cases among the elderly population was higher among women aged 70 years and over. However, the men had a higher prevalence rate among those below 70 years old.
Mild cases of functional difficulty were observed to be highest among persons aged 60 to 64 years. Persons 60 to 64 years old posted the highest prevalence rate (13.2%), followed by those in the age groups 55 to 59 years (12.7%). By sex, the prevalence rate of mild cases was slightly higher among women than among men in the said age groups.
The Population Based on the Religious Affiliation
Of the total household population in Northern Mindanao, majority were Roman Catholics at 71.9 percent. This was followed by Islam at 8.5 percent, Seventh Day Adventist at 2.3 percent, Iglesia Ni Cristo at 1.6 percent, and Bible Baptist at 0.9 percent. Of all religious affiliations, only Islam had higher proportion of men than women.
Table 8. Total Population by Religious Affiliation and Sex, Region 10: 2020
| Religious Affiliation | Both Sexes | Men | Women |
Total Roman Catholic, excluding Catholic Charismatic | 5,007,798 3,599,614 | 2,452,854 1,752,676 | 2,554,944 1,846,938 |
Islam Seventh Day Adventist Iglesia ni Cristo | 423,317 117,229 80,201 | 214,414 58,246 38,905 | 208,903 58,983 41,296 |
| Bible Baptist Church | 44,343 | 22,046 | 22,297 |
Association of Fundamental Baptist Churches in the Philippines | 41,901 | 20,0446 | 21,455 |
| Tribal Religions | 39,710 | 18,901 | 20,809 |
United Church of Christ in the Philippines | 32,403 | 16,043 | 16,360 |
| Others | 629,080 | 311,177 | 317,903 |
| Source: Philippine Statistics Authority, 2020 Census of Population and Housing (2020 CPH) | |||
Married Women by Current Use of Contraception
In 2022, the percentage of contraceptive users in Region X increased by 4.8 percentage points from the 2017 value. The increase was largely brought about by the 4.6 percentage points increase in the users of modern methods of contraception.
Among the modern methods of contraception, the use of pill was the most popular in all the years under consideration. On the other hand, withdrawal was still the most popular traditional method of contraception.
Table 9. Percent Distribution of Currently Married Women Age 15-49 by Current Use of Contraception, Region X: 2013, 2017 and 2022
| Methods Used | 2013 | 2017 | 2022 |
| Any Method | 50.7 | 53.5 | 58.3 |
| Any Modern Method | 37.6 | 44.9 | 49.5 |
| Female Sterilization | 5.2 | 5.7 | 7.3 |
| Pill | 20.2 | 22.5 | 22.3 |
| IUD | 8.5 | 10.4 | 8.8 |
| Injectibles | 1.9 | 3.5 | 2.9 |
| Male Condom | 1.2 | 1.7 | 2.2 |
| Implant | … | 0.7 | 5.1 |
| LAM | 0.0 | 0.2 | 0.8 |
| Other Modern Method | 0.6 | 0.3 | 0.2 |
| Any Traditional Method | 13.1 | 8.6 | 8.8 |
| Rhythm | 5.1 | 3.8 | 2.5 |
| Withdrawal | 7.1 | 4.8 | 6.2 |
| Other | 0.9 | 0.0 | 0.0 |
| Not Currently Using | 49.3 | 46.5 | 41.7 |
| Total | 100.0 | 100.0 | 100.0 |
Source: Philippine Statistics Authority, 2022 National Demographic Health Surveys (NDHS)
Note: Details may not add up to total due to rounding off
… No available data
Domestic Violence
Based on the 2022 National Demographic Health Survey (NDHS), the percentage of women who ever experienced physical and sexual violence since age 15 from any perpetrator has declined over the past 14 years.
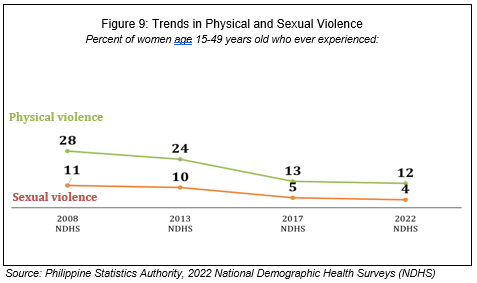
The percentage of women aged 15-49 years who have ever experienced physical violence by any perpetrator since age 15 declined steadily from 28 percent in 2008, to 24 percent in 2013, 13 percent in 2017, and 12 percent in 2022. The same scenario was observed for women who have ever experienced sexual violence by any perpetrator with the percentage declining from 11 percent in 2008 to 10 percent in 2013, five percent in 2017, and four percent in 2022.
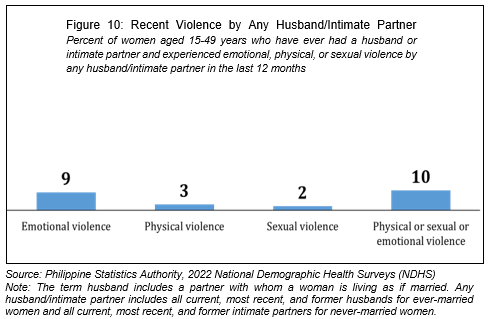
About nine percent of women who have ever had a husband or intimate partner reported having experienced emotional violence in the last 12 months committed by husband or intimate partner, three percent experienced physical violence, two percent experienced sexual violence, and 10 percent experienced physical or sexual or emotional violence.
(SGD.)JANITH C. AVES, CE, DM
Regional Director
| Attachment | Size |
|---|---|
|
|
3.92 MB |