Home


National Accounts

7.2%
Growth Rate
as of 4th Quarter 2022
Growth Rate
as of 4th Quarter 2022
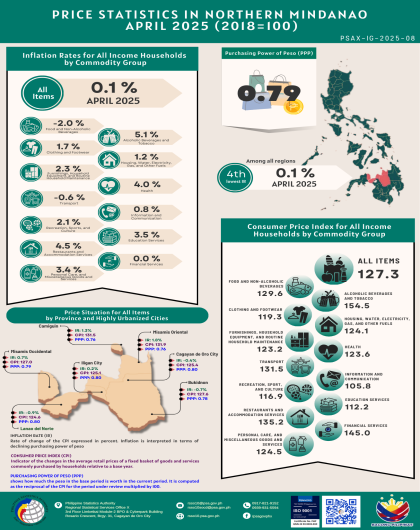
Prices

4.7%
Inflation Rate
in November 2023
Inflation Rate
in November 2023
Trade

$0.35 p
Imports
FOB Value (in billions) in November 2023
Imports
FOB Value (in billions) in November 2023
Vital Statistics

783,199
Registered Births
Jan to Sept 2022
Registered Births
Jan to Sept 2022
Poverty

28,871
Annual Per Capita Poverty Threshold (in PhP) in 2021
Annual Per Capita Poverty Threshold (in PhP) in 2021
Income and Expenditures

PhP 307,109.00
Average Family Income
Jan to Dec 2021
Average Family Income
Jan to Dec 2021
Health

Labor

95.2%
Employment Rate
in February 2023
Employment Rate
in February 2023


Some of the most commonly asked questions and corresponding solutions regarding civil registration are found in this page.
Ways on how to request data from PSA:
- Fill out the online Data Request Form (https://beta.psa.gov.ph/content/data-request-form).
- Contact the PSA Information Section (by email: info@psa.gov.ph or by phone: 8462 6600 loc. 839) and provide details on your data request.
- Visit the Freedom of Information (FOI) portal (https://www.foi.gov.ph/). For more information, see the PSA's FOI Procedures Manual | People's Manual.
- Visit the PSA Library at 5/F, CVEA Bldg., PSA Complex, East Avenue, Diliman, Quezon City.
- Send a letter requesting for dataset addressed to the PSA National Statistician.
Read More
I. Overview of the PhilSys
WHAT IS REPUBLIC ACT NO. 11055?
Republic Act No. 11055, or the Philippine Identification System Act, was signed by President Rodrigo Roa Duterte on 06 August 2018. It is an act establishing a single national identification system that aims to provide valid proof of identity for Filipino citizens and resident aliens of the Philippines.
WHAT IS PHILSYS?
The Philippine Identification System or PhilSys refers to the government’s central identification platform for all Filipino citizens and resident aliens of the Philippines.


.png)
.png)
.png)